
Fig. 2.
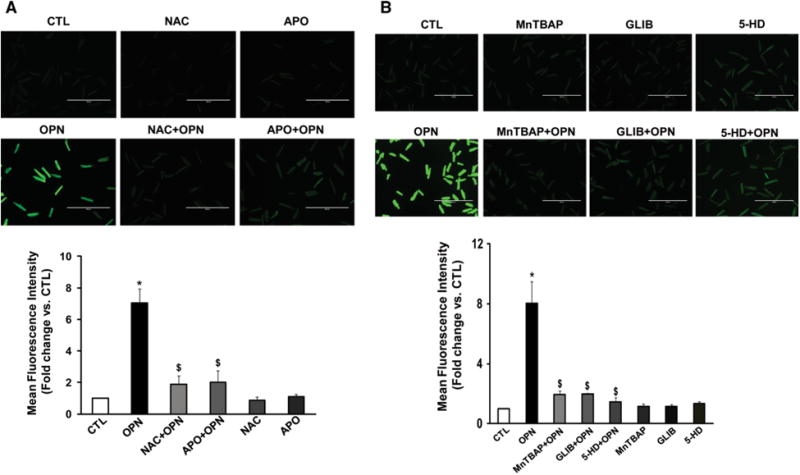
Involvement of NADPH oxidase and mitochondria in ROS production. ARVMs were pretreated with NAC or APO (a), MnTBAP, GLIB or 5-HD (b) for 30 min followed by treatment with OPN for 6 h. The cells were then stained with H2DCFDA. The upper panels exhibit representative images of H2DCFDA-stained cells, while lower panels exhibit mean fluorescence intensity, *p < 0.05 versus CTL; $p < 0.05 versus OPN; n = 3–7