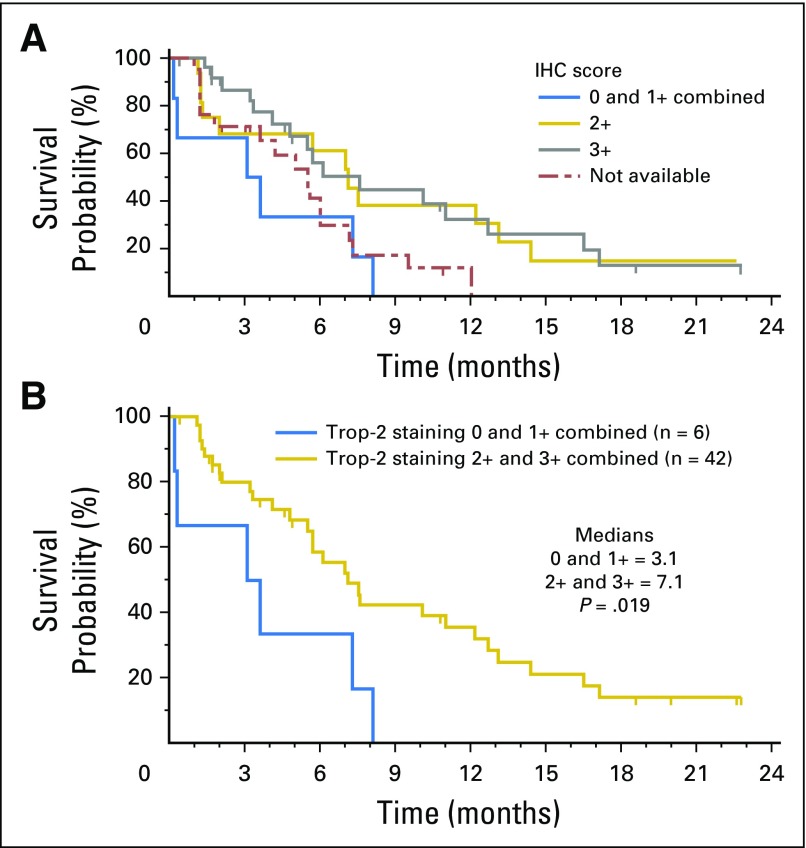
Fig A2.
Trop-2 IHC scoring vs. PFS (n = 48). (A) Kaplan-Meier plot for 4 separate groups with the 0 (n = 2) and 1+ (n = 4) combined, including 21 patients who did not have a specimen for Trop-2 analysis. (B) Kaplan-Meier plot comparing PFS for patients with specimens stained 0 and 1+ combined vs. those with 2+ and 3+ Trop-2 staining combined.

