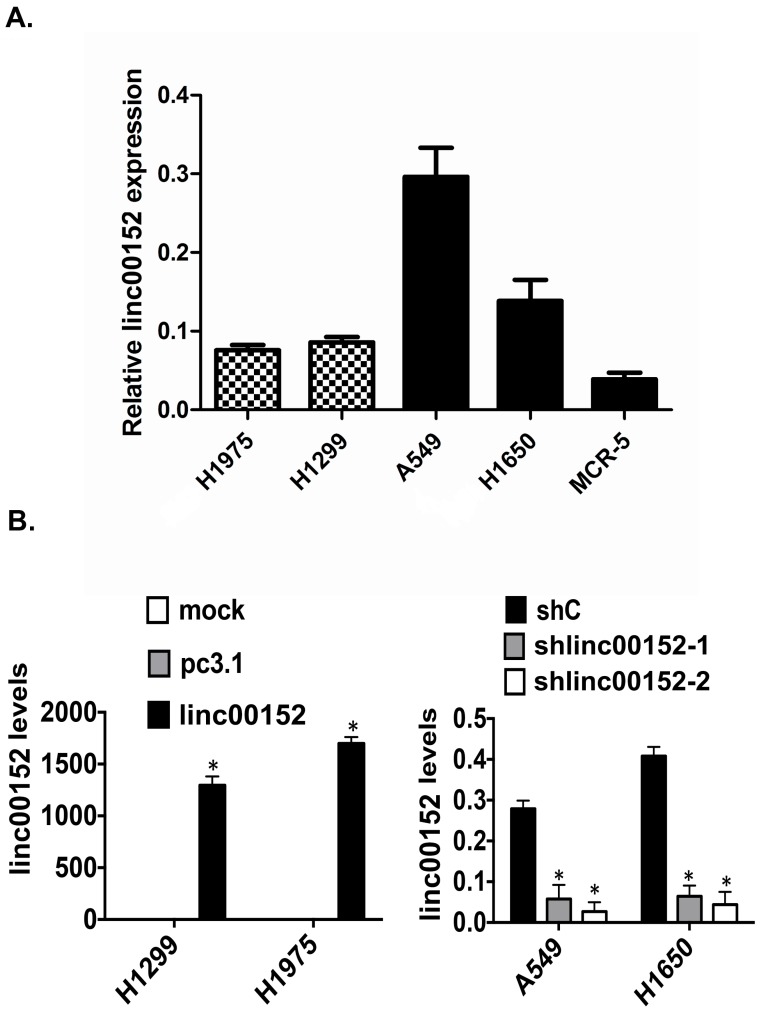
Figure 2.
Linc00152 overexpression and knockdown in lung cancer cell lines. A: A statistical analytical graph of the baseline Linc00152 mRNA levels in 5 lung cancer cell lines, as detected by RT-qPCR. Actin was used as an endogenous control. B: A statistical analytical graph of Linc00152 mRNA levels in H1299 and H1975 cells that were transfected with pcDNA3.1-Linc00152 by RT-qPCR. *: p<0.01. C: A statistical analytical graph of Linc00152 mRNA levels in A549 and H1650 cells that were infected with shNC and shLinc00152-1 and -2 by RT-qPCR. *: p<0.01.

