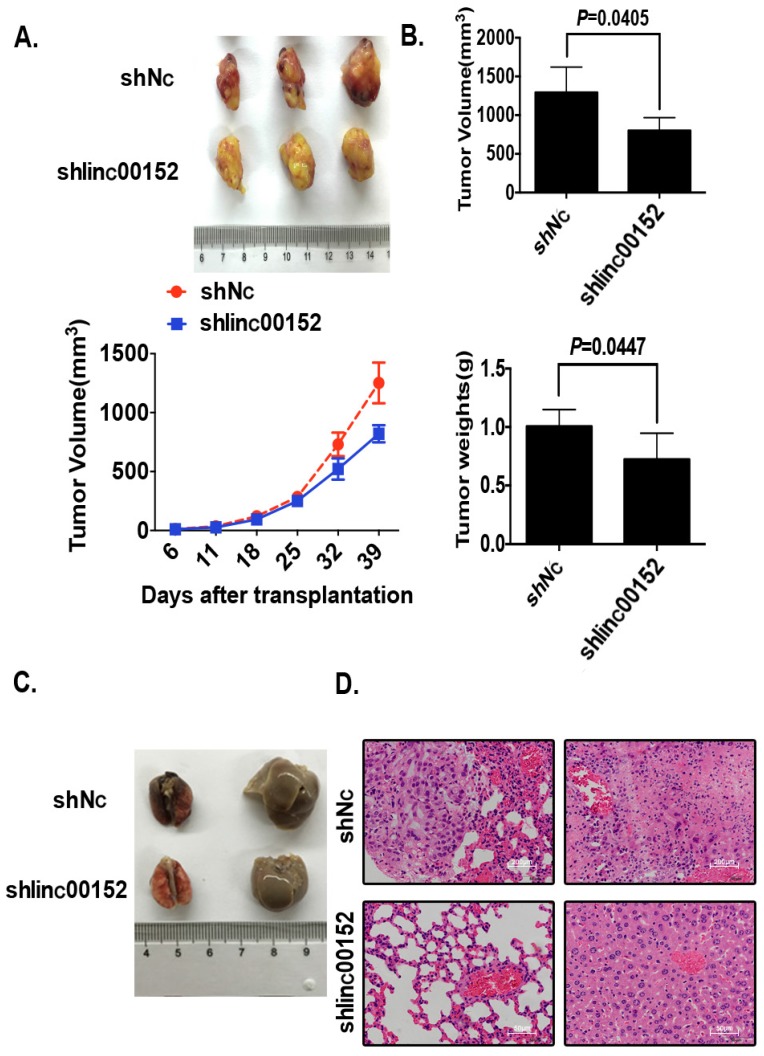
Figure 5.
Linc00152 promoted xenograft growth and metastasis in nude mice models. A: Representative xenograft images (top) of the Lenti-shNC and Lenti-shLinc00152 H1299 groups, and the statistical analytical graph (bottom) of the xenograft tumor growth speed. The error bars are shown. *: p<0.01. B: A statistical analytical graph of the xenograft tumor weights and volumes. The error bars are shown. *: p<0.01. C: The representative gross photos of lung and liver tissues from Lenti-shNC and Lenti-shLinc00152 A549 groups. D: The representative H&E photos of lung and liver tissues from Lenti-shNC and Lenti-shLinc00152 A549 groups. Top: The scale bars=200µm. Bottom: The scale bars=50µm.

