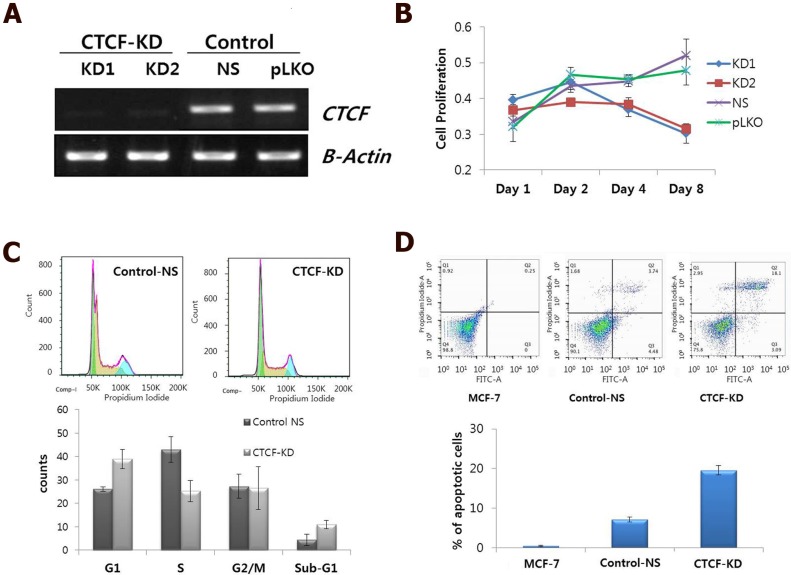
Figure 1.
Effect of CTCF knockdown on cell proliferation, cell cycle and apoptosis in MCF-7 cells. (A) mRNA expression of CTCF in CTCF knockdown (KD1 and KD2) and control (non-specific [NS] and empty vector [pLKO]) cells. (B) Cell proliferation was monitored by MTT assay in a time course experiment of MCF-7 cells for the CTCF knockdown (KD1 and KD2) and control (non-specific [NS] and empty vector [pLKO]) group. Y-axis represents the mean value with standard error of the relative proliferation rate. (C) FACS analysis of cell cycle by PI staining. Cell cycle distribution of control non-specific (Control-NS) and CTCF knockdown (CTCF-KD) MCF-7 cells. The distributions of cell populations in each cell cycle phase are presented as bar graphs (lower panel). Data are expressed as the mean value with standard error. (D) FACS analysis of apoptosis by Annexin V and PI staining for Control-NS and CTCF-KD MCF-7 cells as well as parent MCF-7 cells. The '% of apoptotic cells' shown in a bar graph is the sum of 'early apoptotic' (bottom right) and 'apoptotic' (top right) cell population in the scatter plot. Data are expressed as the mean value with standard error from three experimental replicates.

