Figure 3.
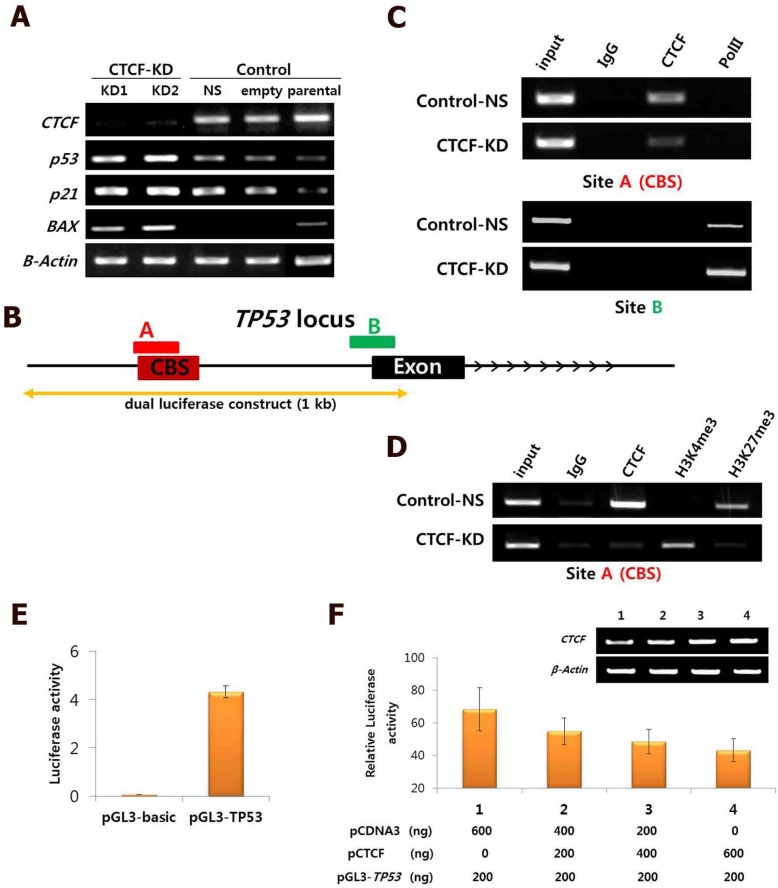
Negative regulation of CTCF on p53 expression. (A) mRNA expression of CTCF, p53, p21, and Bax in CTCF knockdown (KD1 and KD2) and control (non-specific [NS] and empty vector [pLKO]) cells. (B) Schematic view of the TP53 gene locus with a CTCF-binding site (CBS). 'A' and 'B' represent amplified regions for ChIP-PCR. See Figure S4 for details. (C) ChIP-PCR analysis for CTCF and PolII binding on site A and B in Control-NS and CTCF-KD MCF-7 cells. (D) ChIP-PCR results for H3K4me3 and H3K27me3 on site A in Control-NS and CTCF-KD cells. (E-F) Analysis of TP53 promoter activity by the luciferase reported plasmid pGL3-TP53 (E) and CTCF dose-dependent inhibition of TP53 promoter activity in MCF-7 cells (F). Data are expressed as the mean value with standard error from four experimental replicates. The TP53 genomic region cloned into the pGL3 vector is presented in (B).

