
Figure 1.
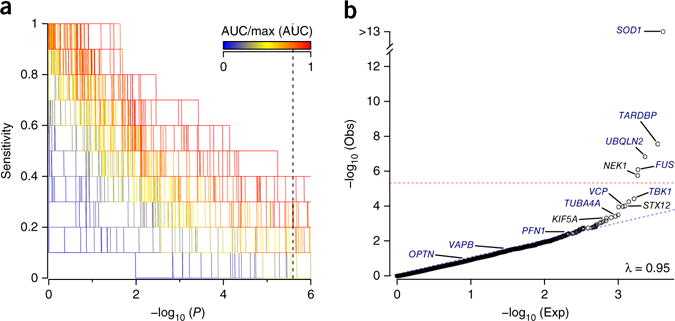
RVB analysis of FALS exomes. (a) RVB analyses of 1,022 index FALS cases and 7,315 controls for 10 known ALS genes, to assess 308 different combinations of MAF and functional prediction filters (Supplementary Table 1). The set of analysis parameters achieving the highest sensitivity for known ALS genes was identified as that achieving the highest area under the curve (AUC) in a plot of sensitivity (proportion of training genes achieving significance) across an increasing minimum P-value threshold. Dotted vertical line denotes Bonferroni-corrected P value for exome-wide significance. (b) Extension of the highest performing known gene-trained analysis to the entire exome. Threshold for exome-wide significance is denoted by the dotted red line. λ, observed genomic inflation factor. ‘Obs’ describes the P-value distribution for the observed data. ‘Exp’ describes the P-value distribution under null expectation.