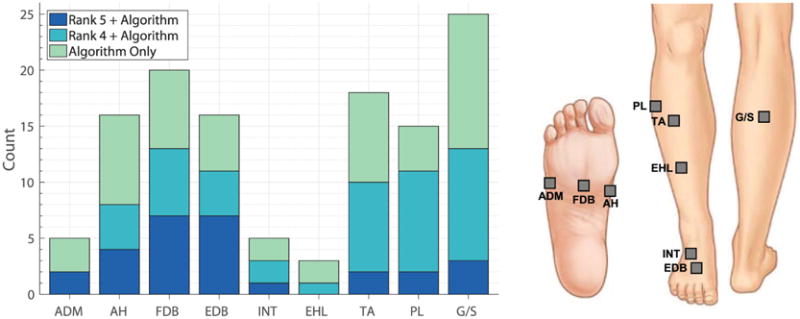
Figure 5.

Histogram of muscle occurrence in active channels, along with depiction of general recording location for each of these muscles. Channels which ranked a 5 or 4 in the visual inspection analysis (Method A) are shown by the darker bars, and additional channels denoted by the algorithm (Method B) are shown by the lighter bars.
