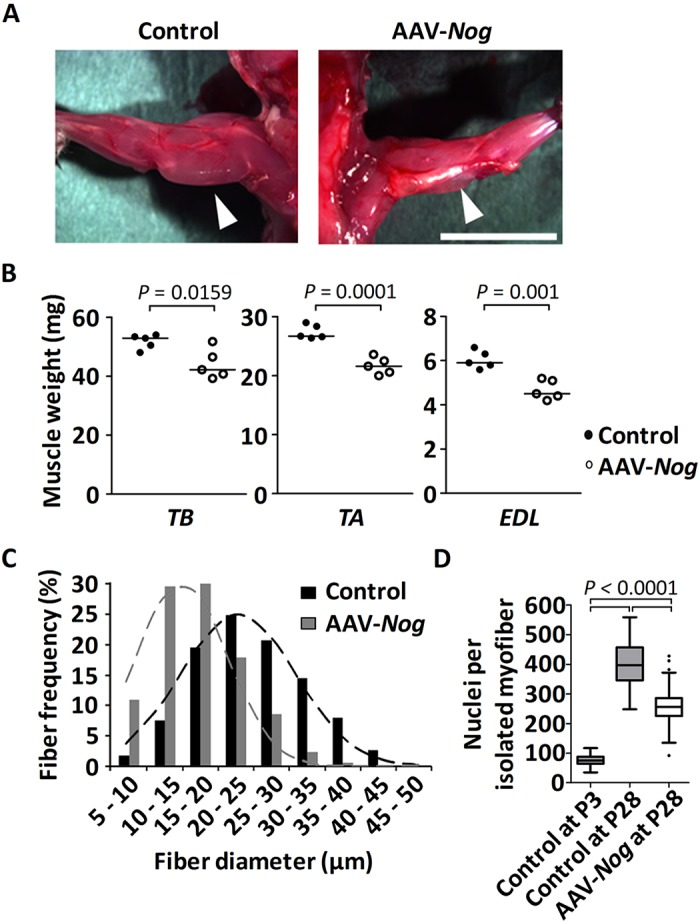
Fig. 3.

Consequences of Nog-mediated abrogation of BMP signaling for postnatal muscle growth. Triceps brachii (TB) muscle and the anterior compartment of the lower hindlimb were transduced with AAV-Nog at P3. Muscles were analyzed at 4 weeks of age. (A) Dorsal view of the forelimb shows significant muscle hypotrophy (arrowheads) of the AAV-Nog-treated TB muscle (right) when compared with the control saline-injected contralateral side (left). Sample images of n=4 injected mice. Scale bar: 1 cm. (B) Dot plots depict muscle wet weight of TB, TA and EDL muscles. Horizontal lines represent the median. (C) Histogram of the fiber diameters of 4-week-old TA muscle, analyzed on mid-belly muscle sections following immunostaining against laminin. Dashed lines represent the fitted normal distribution. (D) The number of myonuclei per single fiber of the TA muscle at P3 (n=50 fibers from 3 mice) and at P28 following AAV-Nog (n=120 fibers from 3 mice) or saline (n=68 fibers from 3 mice) injections at P3. Data are depicted as Whiskers-Tukey box plots. Boxes indicate the interquartile range (IQR), the horizontal line indicates the median, whiskers indicate [1.5 × IQR] and dots indicate the outliers.
