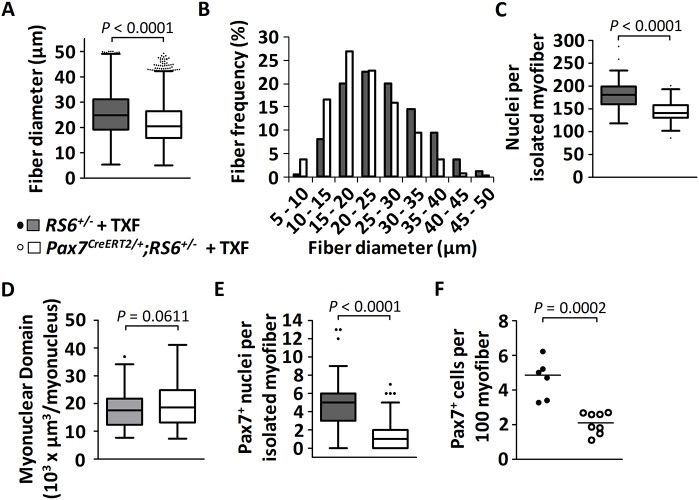
Fig. 6.
Consequences of SMAD6-mediated abrogation of BMP signaling in neonatal satellite cells on juvenile muscle growth. Mice were injected with tamoxifen (TXF) at P7 and P9, and sacrificed at the age of 1 month. (A,B) Quantification of the diameter of TA muscle fibers [depicted as Whiskers-Tukey box plots (A) and as a histogram (B)] of mid-belly muscle sections following immunostaining against laminin, from control tamoxifen-treated RS6+/− mice (n=5, gray) compared with tamoxifen-treated Pax7CreERT2/+;RS6+/− mice (n=4, white). (C) The Whiskers-Tukey box plots depict the number of myonuclei per isolated muscle fiber from EDL muscles from control tamoxifen-treated RS6+/− mice (n=51 isolated fibers from 3 mice) compared with tamoxifen-treated Pax7CreERT2/+;RS6+/− mice (n=66 isolated fibers from 4 mice). Boxes indicate the interquartile range (IQR), the horizontal line indicates the median, whiskers indicate [1.5 × IQR] and dots indicate the outliers. (D) The Whiskers-Tukey box plots depict the myonuclear domain analyzed on segments of isolated single fibers from control tamoxifen-treated RS6+/− mice (n=98 segments from 33 fibers) compared with tamoxifen-treated Pax7CreERT2/+;RS6+/− mice (n=182 segments from 61 fibers). (E) The Whiskers-Tukey box plots depict the number of Pax7+ satellite cells per isolated muscle fiber from EDL muscles from control tamoxifen-treated RS6+/− mice (n=51 fibers from 3 mice) compared with tamoxifen-treated Pax7CreERT2/+;RS6+/− mice (n=73 fibers from 4 mice). Boxes indicate the interquartile range (IQR), the horizontal line indicates the median, whiskers indicate [1.5 × IQR] and dots indicate the outliers. (F) The dot plot (median indicated by the horizontal line) depicts the number of Pax7+ satellite cells per 100 muscle fibers from TA muscles from control tamoxifen-treated RS6+/− mice (n=6, black dots) compared with tamoxifen-treated Pax7CreERT2/+;RS6+/− mice (n=8, white dots).

