Fig. 4.
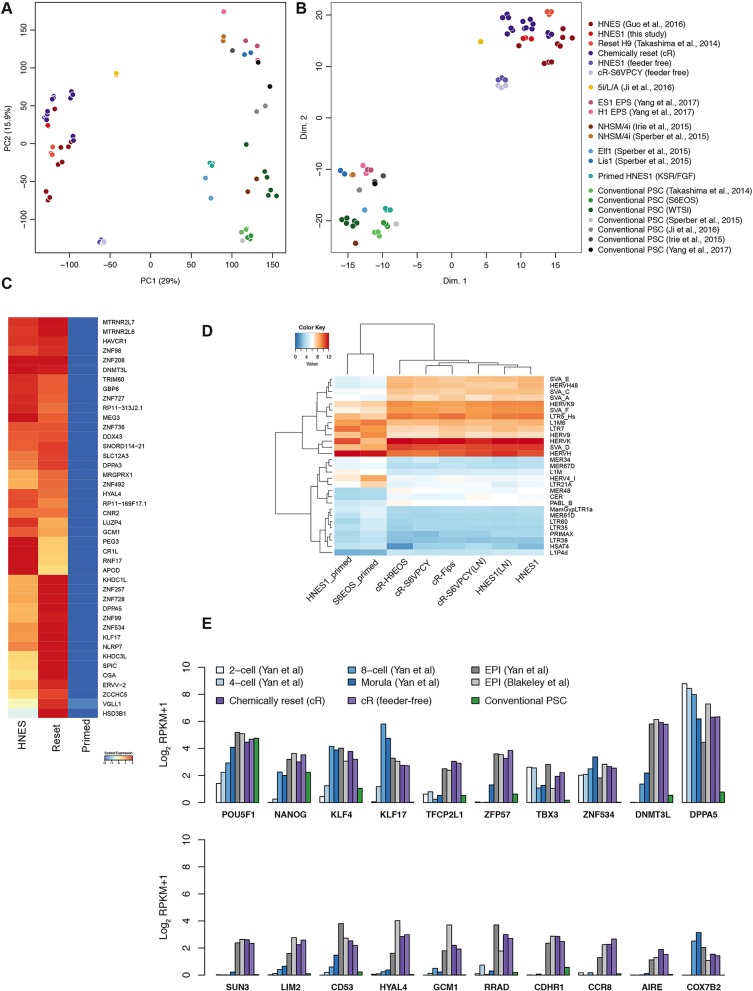
Transcriptome analysis of reset PSCs. (A) Principal component analysis (PCA) of whole-transcriptome RNA-seq data from the indicated cell lines. (B) t-SNE analysis of RNA-seq data. (C) Heatmap of differentially expressed genes between chemically reset (cR) and embryo-derived HNES cells (naïve) compared with conventional hPSCs (primed). Genes unregulated in naïve cells are shown, ranked by log2 fold-change (FC). Values displayed correspond to the average expression level in each sample group scaled by the mean expression of each gene. (D) Heatmap showing expression of all transposon families that are differentially expressed (log2 FC>1.5, P<0.05). (E) Comparative expression of pluripotency markers in human embryo cells (Blakeley et al., 2015; Yan et al., 2013), HNES cells, cR cells, conventional primed PSCs, NHSM cultures and purported expanded potency (EPS) cells. Data shown reflect mean expression levels from cell lines and biological replicates belonging to each sample group, and single cells from indicated embryo stages. Published datasets used are identified in the Materials and Methods.

