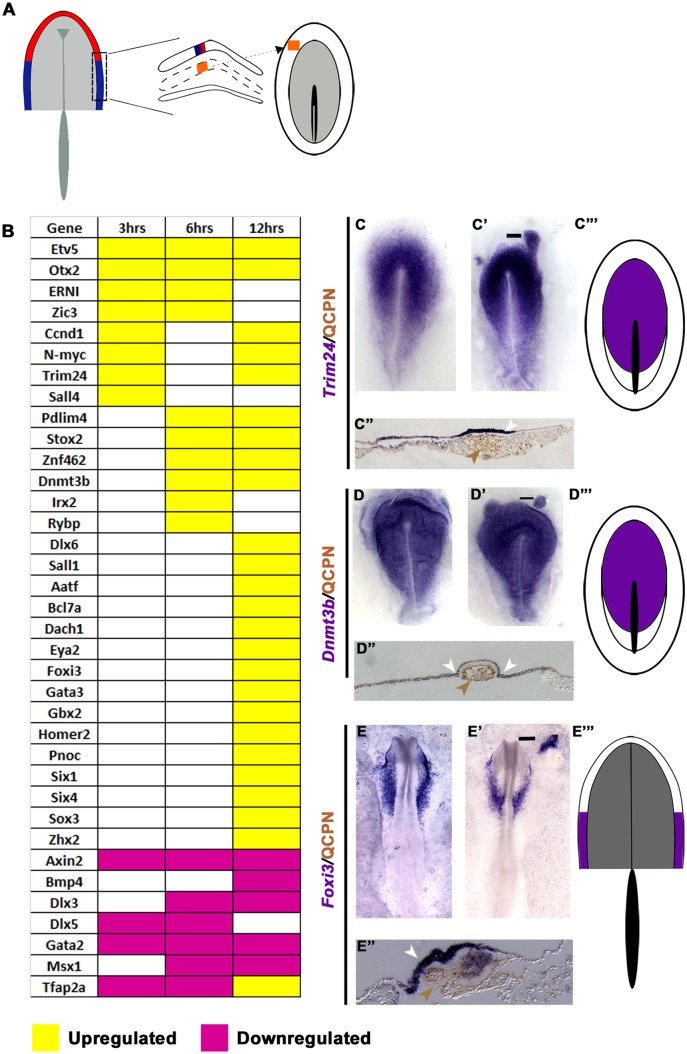
Fig. 3.
Response to the lHM. (A) lHM (HH6; orange) was grafted into HH4− hosts; the adjacent ectoderm was analysed after 3, 6 and 12 h. (B) Transcripts induced or repressed (P<0.05; >1.2-fold change). (C-E‴) Expression patterns of 3 h (C-C‴), 6 h (D-D‴) and 12 h (E-E‴) induced genes. Quail lHM (brown arrowheads) induces Trim24 (C′,C″ white arrowhead), Dnmt3b (D′,D″ white arrowheads) and Foxi3 (E′,E″ white arrowhead). Bars in C′-E′ indicate the level of the sections shown in C″-E″. Area of overlap (purple) is summarised for 3 h (C‴), 6 h (D‴) and 12 h (E‴) induced transcripts.

