Fig. 7.
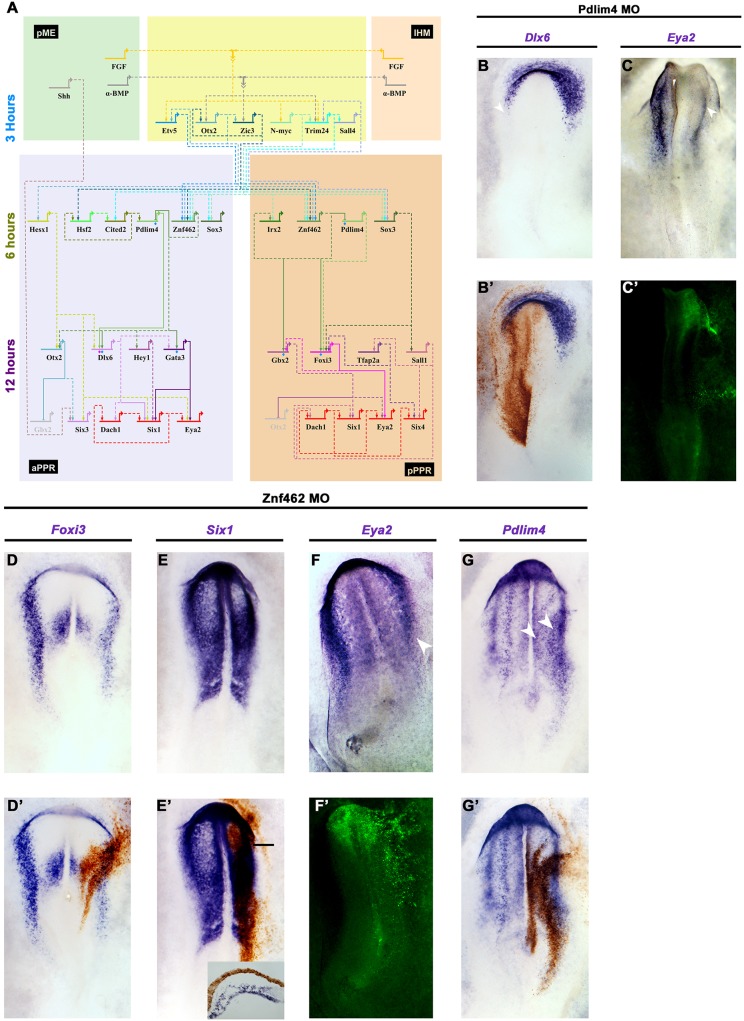
A predicted gene network reveals new candidate Six1 and Eya2 regulators. (A) BioTapestry network that integrates time series of transcript induction and interactions predicted from GENIE3. Genes induced after 3 h, blue; 6 h, green; 12 h, purple; PPR genes, red. Dashed lines indicate predicted interactions; solid lines indicate known interactions and those experimentally verified in this study (blue diamonds for Znf462, pink diamonds for Pdlim4). (B-C′) Pdlim4 knockdown results in reduction of Dlx6 (B,B′; 5/5) and Eya2 (C,C′; 3/6). Arrowheads indicate changes in gene expression. (D-G′) Znf462 knockdown leads to reduction of Foxi3 (D,D′; 4/5), Six1 (E,E′; 4/5; inset, transverse section at level of bar) and Eya2 (F,F′; 4/6; arrowhead indicates changes in Eya2 expression), but to an expansion of Pdlim4 into the neural plate (G arrowheads, G′; 3/5). Morpholinos are visualised by DAB staining (brown) or by fluorescence (green).

