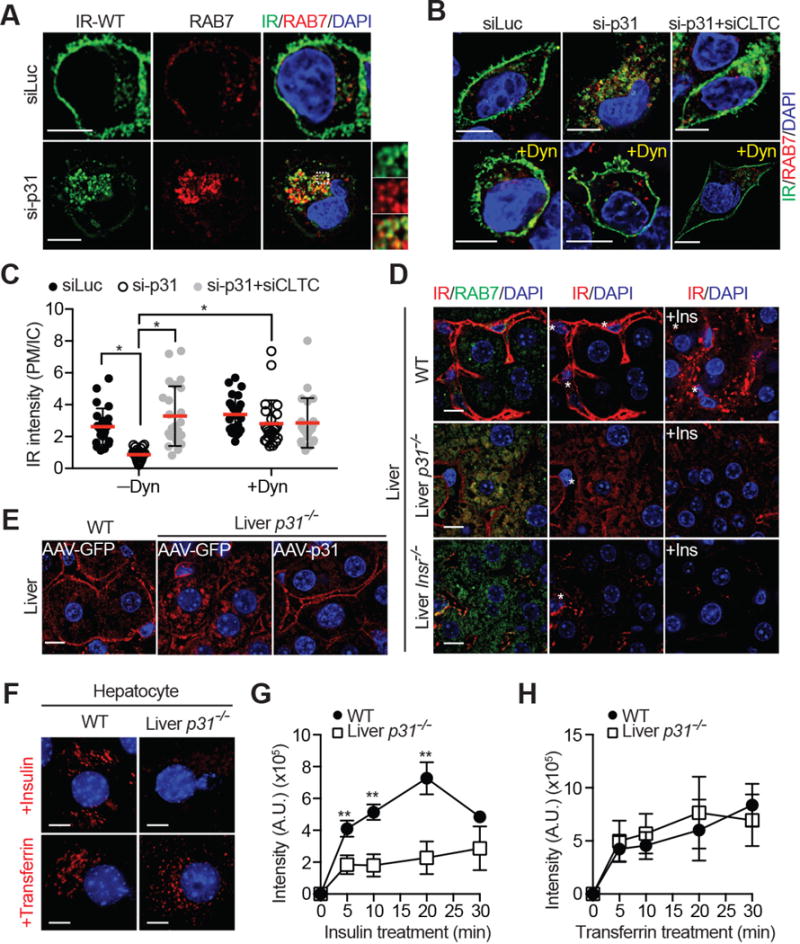
Figure 3. p31comet Suppresses Spontaneous IR Endocytosis in the Absence of Insulin.

(A & B) HepG2 cells stably expressing IR-WT-GFP were transfected with the indicated siRNAs, serum starved, treated without or with 80 μM dynasore (Dyn), and stained with anti-GFP (IR; green) and anti-RAB7 (red) antibodies and DAPI (blue). Scale bars, 10 μm.
(C) Quantification of the ratios of PM and IC IR-GFP signals of cells in (B) (mean ± SD; *p<0.0001).
(D) Liver sections of WT, liver-p31−/−, and liver-Insr−/− mice injected with PBS or insulin (+Ins) were stained with anti-IR (red) and anti-RAB7 (green) antibodies and DAPI (blue). Scale bars, 10 μm. Asterisks indicate sinusoids.
(E) Liver sections of WT and liver-p31−/− mice injected with AAV-GFP or AAV-p31 were stained with anti-IR (red) antibodies and DAPI (blue). Scale bars, 10 μm.
(F) Representative images of endocytosis assays with Cy3-insulin and Alexa 568-transferrin in WT and liver-p31−/− hepatocytes at 20 min. The insulin and transferrin signals are shown in red. The DAPI signals are shown in blue. Scale bar, 10 μm.
(G and H) Endocytosis of insulin (G) and transferrin (H) in WT and liver-p31−/− hepatocytes. The intensities of internalized fluorescent signals at the indicated times were quantified (mean ± SD; n=3 independent experiments with >70 cells analyzed at each time point).
