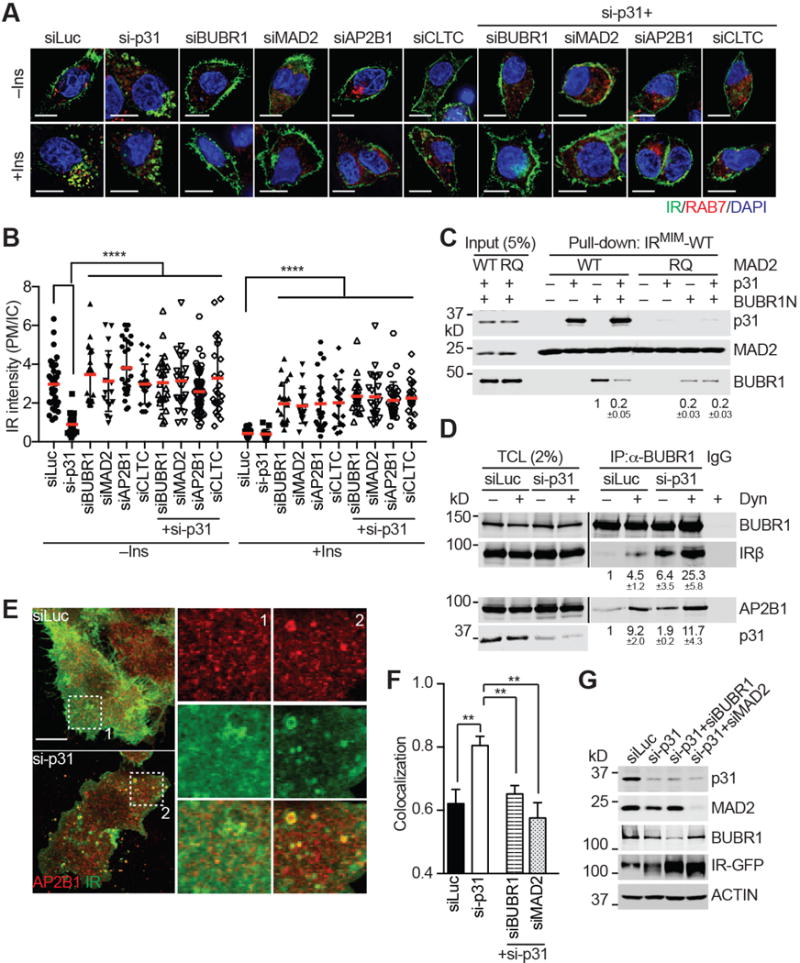
Figure 6. p31comet Prevents MAD2- and BUBR1-dependent IR Endocytosis through Blocking AP2 Recruitment.

(A) IR-GFP-expressing HepG2 cells were transfected with the indicated siRNAs, treated without or with 100 nM insulin (Ins) for 5 min, and stained with DAPI (blue) and anti-GFP (IR; green) and anti-RAB7 (red) antibodies. Scale bars, 10 μm.
(B) Quantification of the ratios of PM and IC IR-GFP signal intensities in (A) (mean ± SD; ****p<0.0001).
(C) The indicated proteins were incubated for 1 hr and added to beads coupled to the IRMIM-WT peptide. Proteins bound to beads were blotted with the indicated antibodies. The relative BUBR1 intensities (mean ± SEM; n=3 independent experiments) are shown below.
(D) 293T cells were transfected with plasmids encoding MYC-BUBR1, AP2B1, and IR, and treated with or without dynasore (Dyn). The total cell lysates (TCL), anti-MYC IP, and IgG IP were blotted with the indicated antibodies. The relative intensities of IRβ and AP2B1 (mean ± SEM; n=3 independent experiments) are shown below.
(E) HepG2 cells stably expressing IR-WT-GFP were transfected with the indicated siRNAs, and stained with anti-GFP (IR; green) and anti-AP2B1 (red) antibodies. Two boxed regions (1 and 2) were magnified and shown. Scale bar, 10 μm.
(F) Quantification of the Manders’ coefficients of IR and AP2B1 co-localization in (E) (mean ± SEM; siLuc, n=16; si-p31, n=26; si-p31/siBUBR1, n=12; si-p31/siMAD2, n=11; **p<0.005).
(G) Western blot analysis of cell lysates in (E and F).
