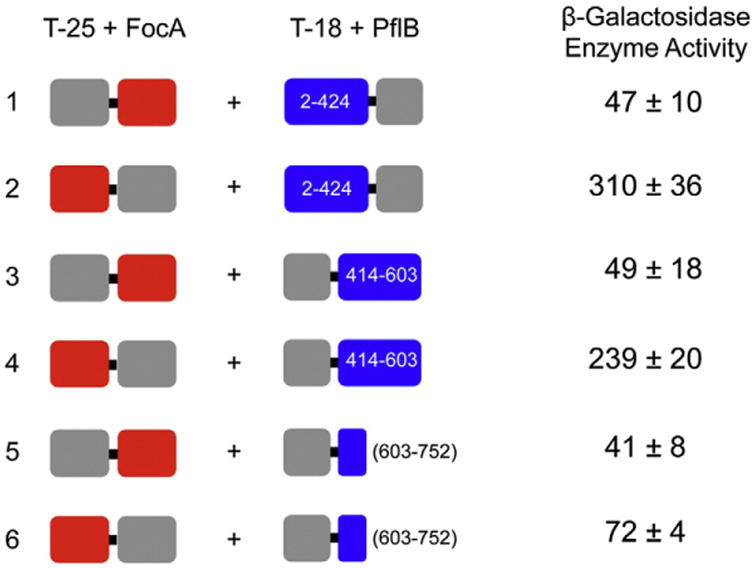
Fig. 3.

Bacterial two-hybrid analysis of the FocA–PflB interaction. The constructs used in the analyses are shown schematically on the left of the figure. The gray boxes indicate either the T25 or the T18 fragment of the catalytic domain of adenylate cyclase, the red boxes signify full-length FocA and the blue boxes indicate PflB fragments. If the gray box is depicted on the left of the fusion construct, this signifies that FocA or PflB was fused to its C-terminus, while if the gray box is on the right, then it was fused to the C-terminus of the respective FocA or PflB fragment. The numbers within or next to the PflB boxes indicate which amino acids of PflB were fused to T18. The β-galactosidase enzyme activity with standard deviation in Miller units (see Materials and Methods) of the respective fusion combinations is shown on the right. Each experiment was performed at least three times in triplicate. The negative control (T25 and T18 plasmids without inserts) had an activity of 44 ± 6 Miller units, while the positive control (T25-zip and T18-zip from GCN4 supplied with the kit; Euromedex GmbH) had an activity of 715 ± 16 units.
