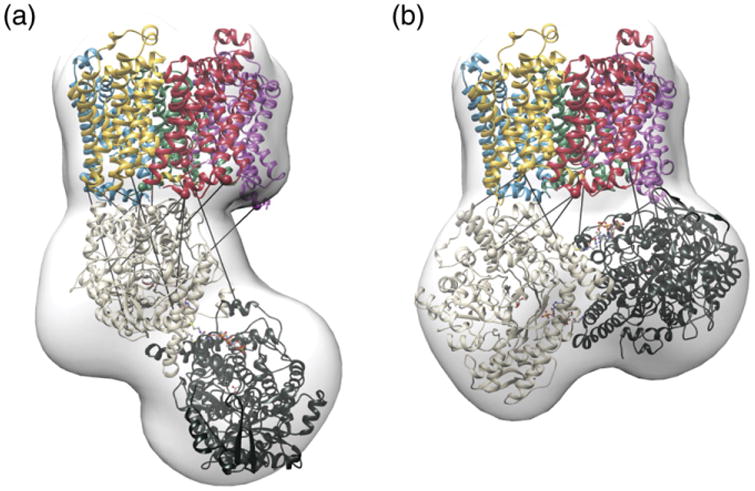
Fig. 6.

Model of the FocA–PflB complex. Conformations a and b were selected by cross-linking restraints from the docking models. FocA and PflB protomers are individually colored. Bars indicate the best-fulfilled cross-link for that model as measured by Cα–Cα distance. Conformational space of the ensemble is represented by the white density envelope. (See also Figs. S3 and S4.)
