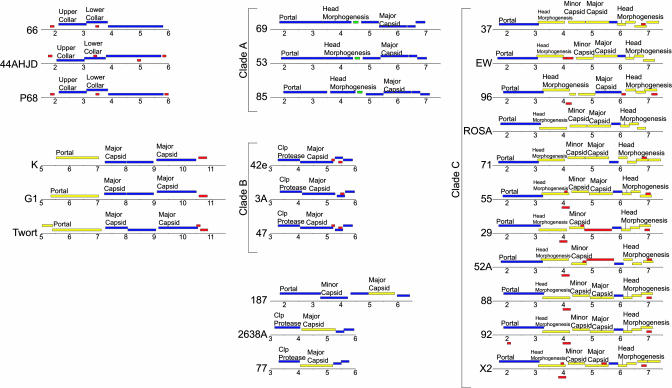
Fig. 3.
Comparative gene arrangements among S. aureus bacteriophage head regions. The gene content of each phage head region and identity of the encoded proteins are indicated by colored boxes, using the same color key as described for Fig. 1. The map location of each head region is indicated and the annotation is aligned such that the leftmost part of the gene is directly below the start of the text. Genes lacking annotation have no predicted function. Note that for PT1028, no head region was identified from the structural ORF map.

