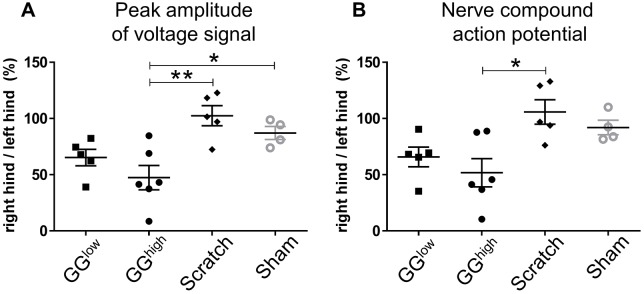
Fig. 2.
Peak amplitude of voltage signal and nerve compound action potential in experimental groups at 3 weeks post-operation. The data for peak amplitude (A) and nerve compound action potential (B) are presented as the ratio of the right hind limb signal to the left hind limb signal, shown as a percentage (×100). GGlow: n=5, GGhigh: n=6, scratch: n=5, sham-operated control: n=4. *P<0.05; **P<0.01.

