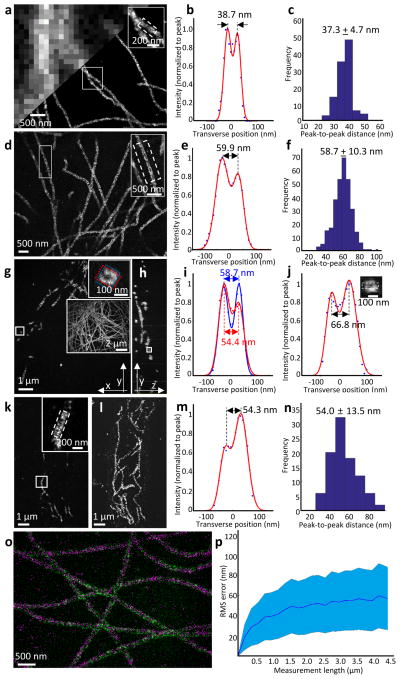
Figure 2. Validation of the nanoscale precision of iterative expansion microscopy.
(a-c) STORM imaging of cultured BS-C-1 cells after microtubules were labeled with an anti-tubulin antibody. (a) Epifluorescence image (upper left) and STORM image (lower right) of microtubules before expansion. The inset in upper right zooms in on the small box at center. (b) Transverse profile of microtubules in the boxed region (dotted lines) of the inset of a after averaging down the long axis of the box and then normalizing to the peak value (blue dots), with superimposed fit with a sum of two Gaussians (red lines). (c) Population data for 110 microtubule segments from two samples (mean ± standard deviation), showing a histogram of peak-to-peak distances. (d–j) Confocal imaging of cultured BS-C-1 cells with labeled microtubules, after ~20-fold expansion via iExM. (d) Single xy-plane image at the bottom of the cell. The inset in upper right zooms in on the small box at left. (e) As in b, but for the inset of d. (f) As in c, but for iExM-processed BS-C-1 cells. n=307 microtubule segments from one expanded sample. (g) Single xy-plane image 1.6 μm above the bottom of the cell. The inset in upper right zooms in on the small box indicated at left, highlighting the circular cross-section of the microtubule (blue and red boxes are used to calculate the profile of i). The large inset at right shows the entire cellular context, as a maximum intensity projection of the sample. (h) Single yz-plane within the volume imaged in g; the small box is highlighted in the inset of j. (i) Transverse profiles (i.e., plotting along the long axis of the highlighting box) of the microtubule in the upper right inset of g, with color corresponding to that of the highlighting box in the inset. (j) Transverse profile of the microtubule in the small box of h. Inset, zoomed-in image of the box of h, showing the cross-section of the microtubule being resolved along the optical axis. (k) Confocal image of a 100-μm thick slice of mouse cortex with microtubules labeled, after ~18-fold expansion via iExM, and imaged at a single xy-plane. (l) Maximum-intensity projection of the sample shown in k. (m) As in e, but for the inset of k. (n) Population data for 96 microtubule segments from one expanded sample, showing a histogram of the peak-to-peak distances. (o) Overlay, using only a rigid registration, of a STORM image (magenta) of cultured BS-C-1 cells stained with anti-tubulin pre-expansion, with a confocal image (green) of the same sample post-expansion. (p) RMS length measurement error of biological measurements, calculated using the distortion vector field method9, using STORM microscopy pre-expansion followed by confocal imaging of iExM-processed samples (~20x expanded) (blue line, mean; shaded area, ± 1 standard deviation; n = 3 samples).

