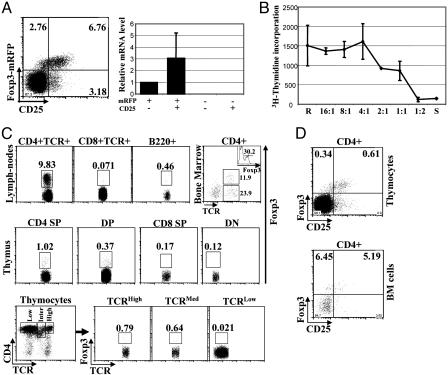
Fig. 2.
mRFP expression faithfully marks Foxp3-expressing CD4 T cells without compromising their regulatory activity, and Foxp3 expression was detected in different lymphocyte compartments. (A) Peripheral lymphocytes from FIR mice were harvested and stained with fluorophore-conjugated anti-CD4 and anti-CD25 antibodies. mRFP expression in CD4 T cells was monitored by flow cytometry (Left). RNA was extracted from different populations of peripheral CD4 T cells (as indicated) purified from FIR mice by FACS. Relative mRNA levels of Foxp3 were determined by TaqMan real-time quantitative PCR, and combined results of two experiments were plotted. (B) CD4+mRFP+ suppressor (S) and CD4+CD25–mRFP– responder (R) T cells were purified by FACS. Suppressor and responder cells were either cultured alone or mixed at indicated ratios (R:S), whereas the number of responder cells remained the same (2 × 10⁴). T cells were activated by soluble anti-CD3 and anti-CD28 antibodies in the presence of irradiated APCs. Three days after stimulation, T cell proliferation was measured by a [3H]thymidine incorporation assay. Combined results from two experiments are shown. (C) In FIR mice, cells from peripheral lymph nodes, bone marrow, and thymus were harvested and stained with fluorophore-conjugated anti-CD4, anti-CD8, anti-B220, and anti-TCR antibodies. By detecting mRFP, the expression of Foxp3 was assessed in CD4 T cells (CD4+TCR+), CD8 T cells (CD8+TCR+), and B cells (B220+) from peripheral lymphocytes (Top Left, Top Left Center, and Top Right Center); in CD4+ cells from bone marrow cells (Top Right with inserted histogram showing the percentage of Foxp3+ cells in CD4+TCR+ population); and in CD4 SP, double-positive (DP), CD8 SP, double-negative (DN) thymocytes (Middle). In addition, based on the expression levels of TCR, CD4+ thymocytes were divided into three groups, TCRHigh, TCRMed, and TCRLow, (Lower Left) and Foxp3 expression in each population was evaluated (Lower Left Center, Lower Right Center, and Lower Right). Typical results of three experiments are shown. (D) Thymocytes and bone marrow cells from FIR mice were stained with fluorophore-conjugated anti-CD4 and anti-CD25 antibodies and analyzed by flow cytometry. Results typical of three experiments are shown.

