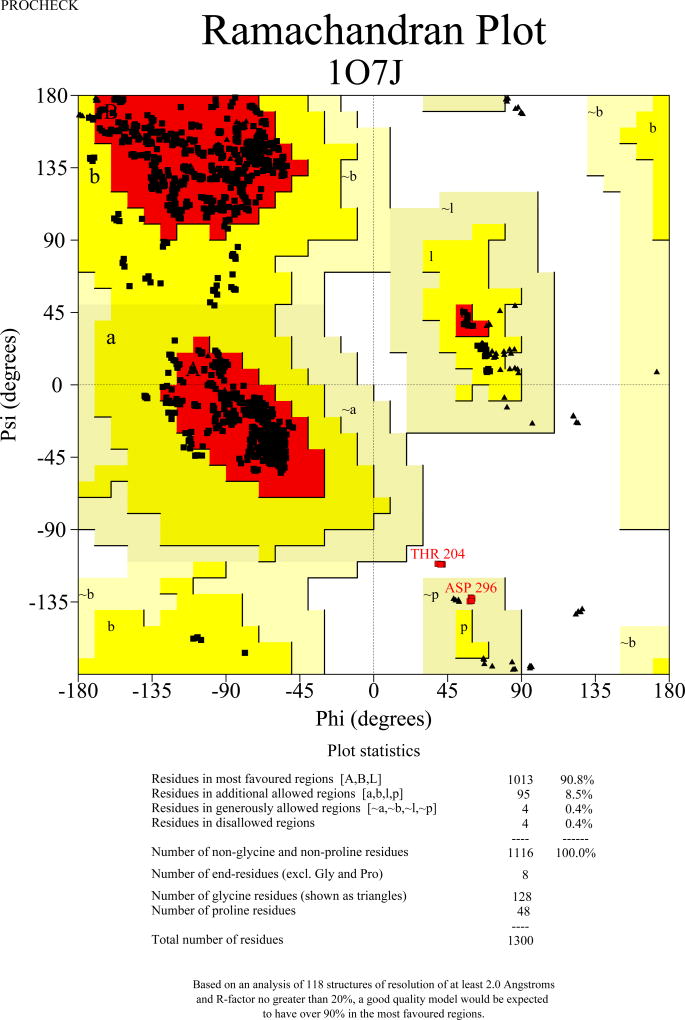
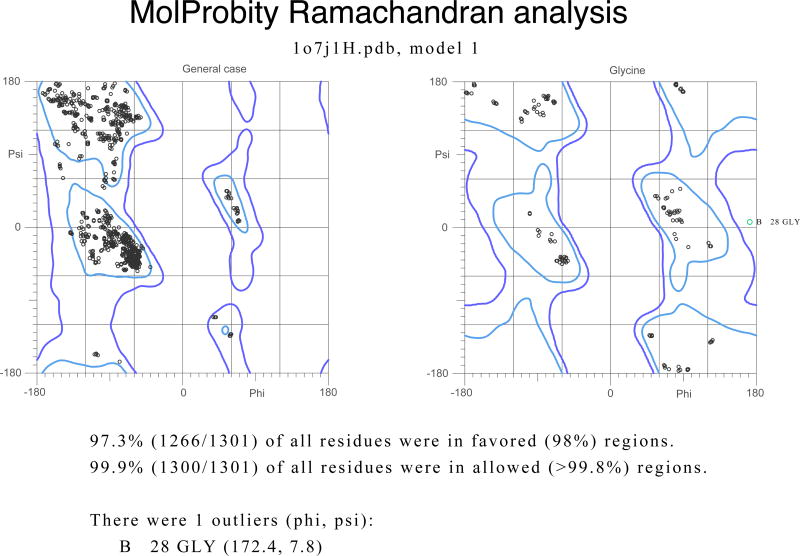
Figure 1.
Ramachandran plots for the tetrameric molecule of Erwinia chrysanthemi L-asparaginase [54]. The structure was refined with data extending to 1 Å resolution. A) A plot prepared with PROCHECK [27], showing that almost all φ/ψ torsion angles are found in the favored or additionally allowed regions. However, Thr204 in each subunit is marked as being in a disallowed region, and Asp296 in a generously allowed area. (The unusual conformation of these residues is supported by the original electron density.) B) An analogous plot prepared with MolProbity [45]. The two residues outside of the allowed region in PROCHECK are no longer considered to be outliers, whereas GlyB28 is now marked as such.


