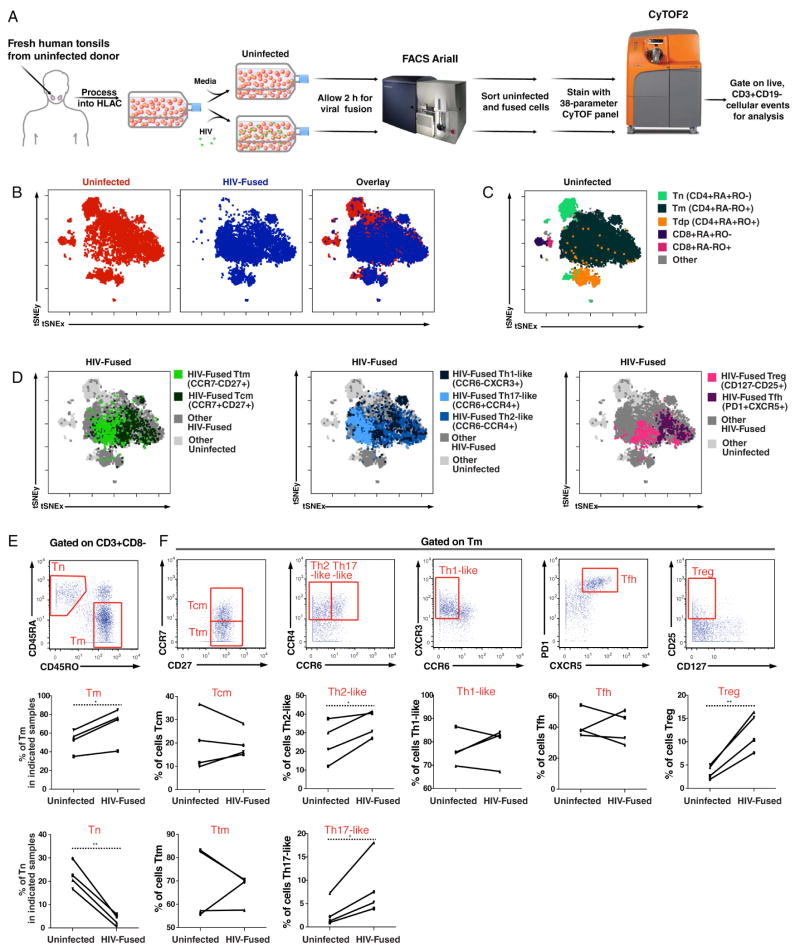
Figure 1. R5-tropic HIV enters a diverse array of memory CD4+ T cells.
(A) Experimental design for phenotyping HIV-fused cells by CyTOF. HLACs were ficolled to remove dead cells and mock-treated or incubated for 2 h with BlaM-Vpr-containing HIV-F4.HSA virions. After loading CCF2, cells supporting fusion (or uninfected cells) were sorted by FACS (Fig. S2) and stained with a 38-parameter panel for phenotyping by CyTOF. Live, CD3+CD19− events were exported for analysis by t-SNE or other dimension reduction methods.
(B) Representation of uninfected and HIV-fused cells by t-SNE based on expression of 35 surface markers. t-SNE plots corresponding to uninfected (red) or HIV-fused (blue) tonsillar T cells were overlaid to demonstrate that not all T cells support fusion to HIV-F4.HSA.
(C) Identification of the main T-cell subsets. Live, singlet CD3+CD19− cells were gated into subsets based on expression of CD4, CD8, the naïve marker CD45RA, and the memory marker CD45RO using standard dot plots. Populations corresponding to naïve CD4+ T cells (Tn), memory CD4+ T cells (Tm), CD4+ T cells expressing both isoforms of CD45 (Tdp), naïve CD8+ T cells, and memory CD8+ T cells were then overlaid onto the t-SNE plot of total T cells to map regions corresponding to these populations. Note regions lacking HIV-fused cells in panel B correspond to Tn and CD8+ T cells.
(D) Identification of Tm subsets that support fusion by HIV-F4.HSA. Live, singlet Tm that fused with HIV-F4.HSA were gated based on expression of CCR7, CD27, CCR4, CCR6, CD25, CD127, PD1, and CXCR5 to identify transitional memory cells (Ttm); central memory cells (Tcm); Th1-, Th2-, and Th17-like cells; regulatory T cells; and follicular helper T cells (Tfh). For each plot, two or three subpopulations of Tm were overlaid onto total HIV-fused and uninfected populations, thus displaying subpopulations of interest in color while remaining ungated HIV-fused cells (“Other HIV-fused”) are shown in dark grey.
(E) Preferential fusion of HIV-F4.HSA to Tm. Top: Gating strategy to identify Tn and Tm populations among live, singlet T cells. Bottom: Line graphs showing proportions of Tm and Tn in uninfected vs. HIV-fused cells in four independent donors. *p<0.05, **p<0.01 as assessed using a paired t-test.
(F) Preferential fusion of HIV-F4.HSA to the Th2-like, Th17-like, and Treg populations. Top: Gating strategy to identify the Tcm; Ttm; Th1, Th2, and Th17-like cells; Tfh, and Treg among Tm. Bottom: Line graphs showing proportions of the indicated Tm subset in uninfected vs. HIV-fused cells in four independent donors. *p<0.05, **p<0.01 as assessed using a paired t-test. See also Fig. S2, S4, and S5.

