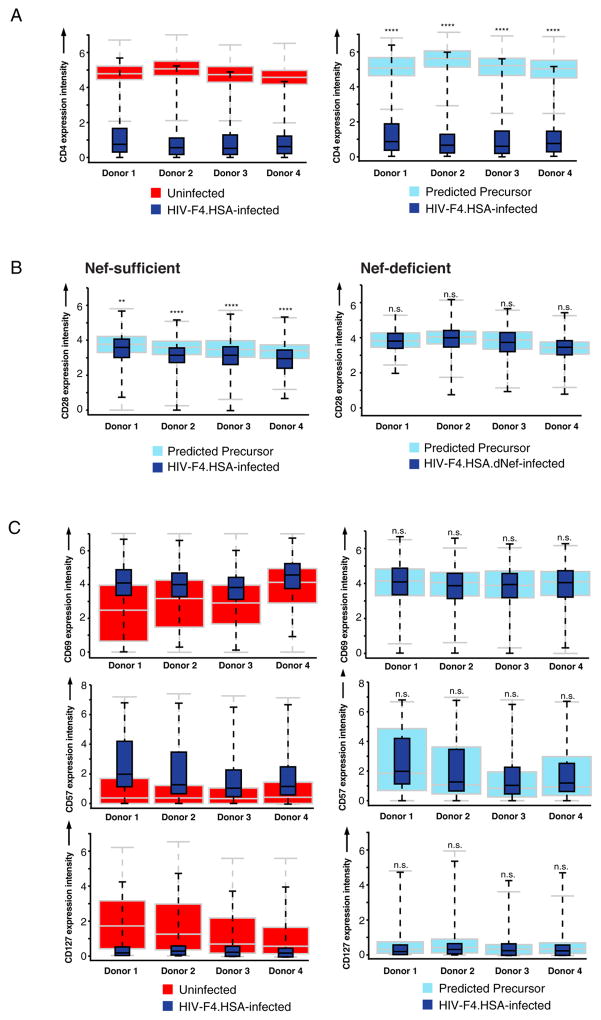
Figure 4. PP-SLIDE analysis of effects of HIV infection on expression levels of cell surface receptors.
(A) PP-SLIDE analysis of CD4 on cells productively infected with HIV-F4.HSA. The left plot shows CD4 expression on infected (dark blue) vs. bulk uninfected (red) cells. The right plot shows CD4 expression on infected (dark blue) vs. predicted precursor (light blue) cells. Levels of CD4 are significantly lower on infected cells relative to their predicted precursors. ****p<0.0001.
(B) PP-SLIDE analysis of CD28 on cells productively infected with HIV-F4.HSA (left) or Nef-deficient HIV-F4.HSA.dNef (right). Box plots show CD28 expression on infected cells (dark blue) relative to predicted precursors (light blue). Significant downregulation of CD28 by HIV-F4.HSA but not HIV-F4.HSA.dNef was observed. **p<0.01, ****p<0.0001, n.s.: non-significant.
(C) PP-SLIDE analysis of CD69, CD57, and CD127 on cells productively infected with HIV-F4.HSA. Left plots show infected (dark blue) vs. bulk uninfected (red) cells, while right plots show infected (dark blue) vs. predicted precursor (light blue) cells. n.s. non-significant as assessed by rejecting the null hypothesis that median antigen levels in infected and uninfected nearest-neighbor cells are statistically equivalent (see Statistics section in Supplemental Experimental Procedures). See also Fig. S7 and S8.

