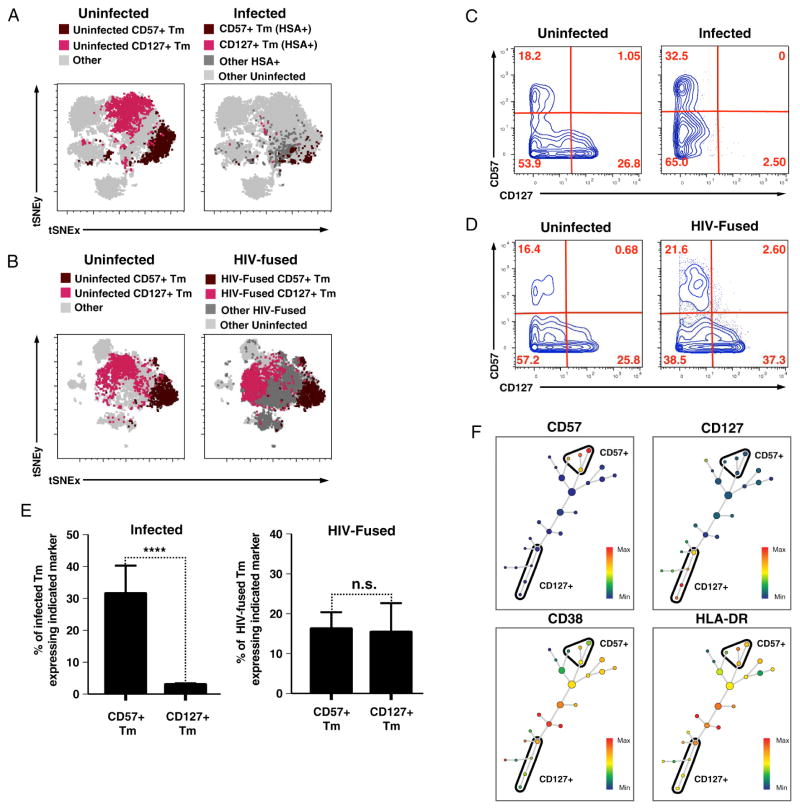
Figure 5. CD57+ and CD127+ Tm exhibit differential susceptibility to productive HIV infection.
(A) CD57+ but not CD127+ Tm are well-represented among cells productively infected with HIV-F4.HSA. t-SNE overlays of uninfected (left) or infected (right) Tm expressing CD57 or CD127. Note the paucity of CD127+ Tm (magenta) among infected cells.
(B) Both CD57+ and CD127+ Tm are well-represented among cells that support fusion to HIV-F4.HSA. t-SNE overlay of uninfected (left) or HIV-fused (right) Tm expressing CD57 or CD127. Note the prevalence of CD127+ Tm (magenta) among HIV-fused cells.
(C) Standard FACS plots of CD57 and CD127 expression in uninfected (left) and infected (HSA+) (right) cells. Events shown were pre-gated on live, singlet Tm. Note the paucity of CD127+ cells (bottom right-hand quadrant) among infected but not uninfected cells.
(D) Standard FACS plots of CD57 and CD127 expression in uninfected (left) and HIV-fused (right) cells. The plots shown were pre-gated on live, singlet Tm. Note that unlike in panel C, CD127+ cells are abundant in both samples.
(E) Proportion of CD57+ and CD127+ Tm among infected (HSA+) and HIV-fused cells. Results correspond to data from 4–5 donors. Error bars correspond to standard deviations. ****p<0.0001. Note that while CD57+ Tm and CD127+ Tm were equally represented among HIV-fused cells (right), the proportion of CD127+ Tm was significantly lower among productively-infected cells (left).
(F) CD38 and HLADR are expressed by both CD57+ and CD127+ Tm. HIV-fused Tm were distributed by SPADE into 25 nodes based on 35 cell-surface markers and subsequently colored by levels of the indicated markers. Note expression of CD38 and HLADR in clusters of both CD57+ and CD127+ Tm.

