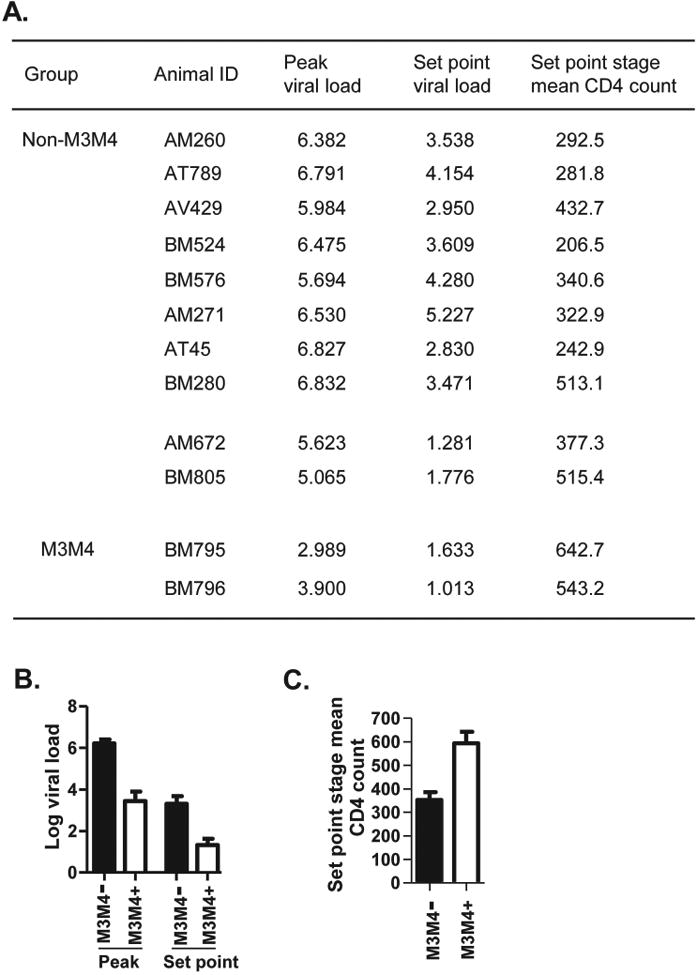
Figure 2. Quantitative analysis of viral loads and CD4 counts in Non-M3M4 versus M3M4 monkeys.

(A) List of peak and set point viral loads (Log SIV RNA copies/ml plasma) and set point stage mean CD4 counts (cell number/μl blood) in SIV-infected monkeys from Fig. 1. (B) Peak and set point viral loads were compared between Non-M3M4 monkeys (M3M4-, all animals from Fig. 1A and B combined) and M3M4 monkeys (M3M4+, animals from Fig.1C). Data are mean ± SEM. (C) Set point stage mean CD4 count (CD4+ cell number/μl blood) was compared between the two groups.
