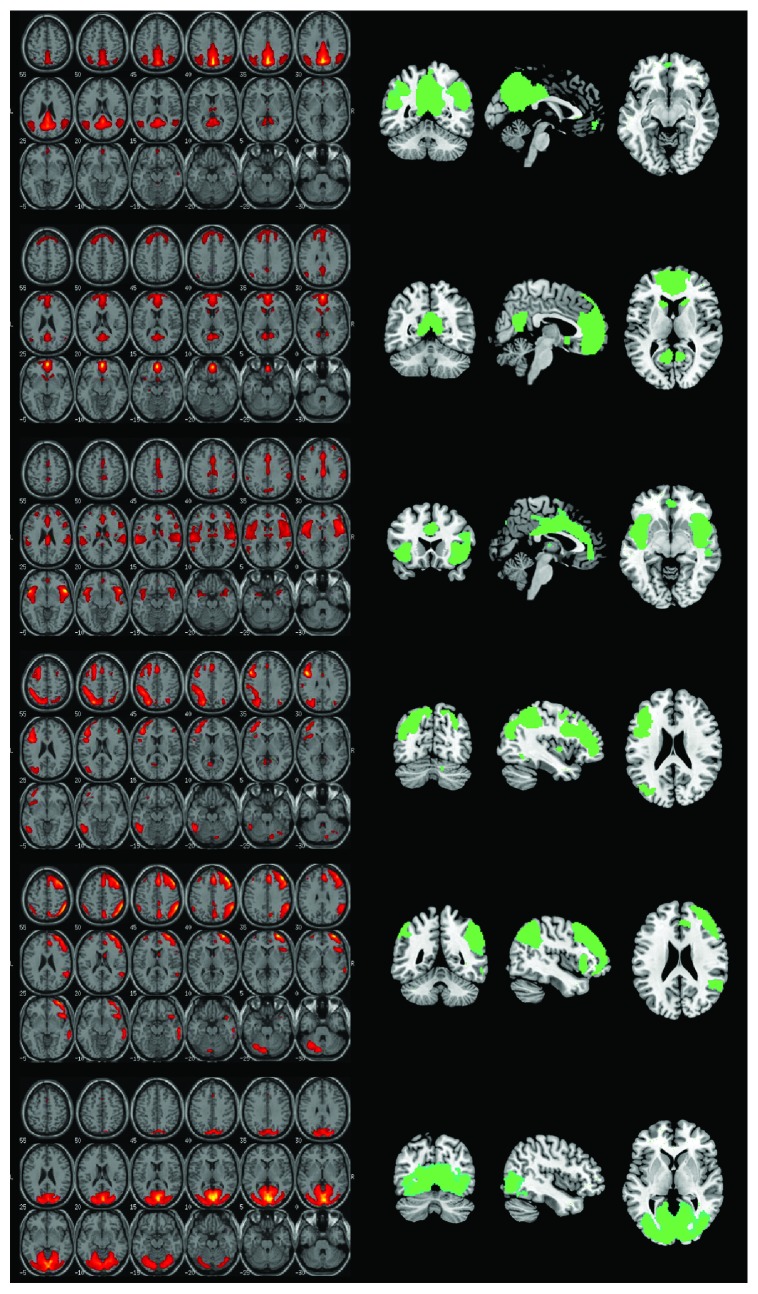
Figure 1.
The six haemodynamic networks selected for this study, top to bottom: posterior default-mode network, anterior default-mode network, salience network, left frontoparietal network, right frontoparietal network, and visual network. The output of the independent component analysis is illustrated on the left, with maps expressing the z scores of each component. These same maps are shown on the right side as the output of a one-sample t-test carried out on the entire group.

