
Figure 5. Osteochondral composites obtained by combining pre-grown cartilage and bone.
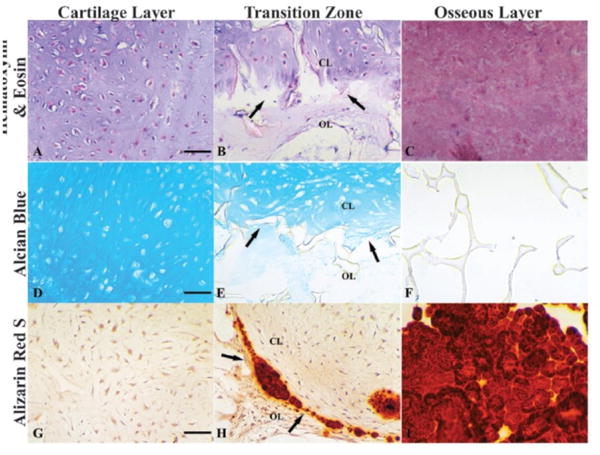
The panel shows osteochondral constructs cultured for 10 weeks following the assembly of cartilage and bone regions. (A–C) H&E for the cells and matrix of the cartilage layer (A), sharply demarcated transition zone (B, arrows), and an osseous layer (C); (D–F) alcian blue, for proteoglycan that is strongly positive in the cartilage layer (D), diminishingly positive in the transition zone (E, arrows), and negative in the osseous layer (F); (G–I) alizarin red staining, for mineralization that was negative in the cartilage layer (G), and strongly positive in the transition zone (H, arrows) and the osseous layer (I). CL: cartilage layer; OL: osseous layer. Scale bars: 80 μm. Reproduced with permission from Tuli et al (78).