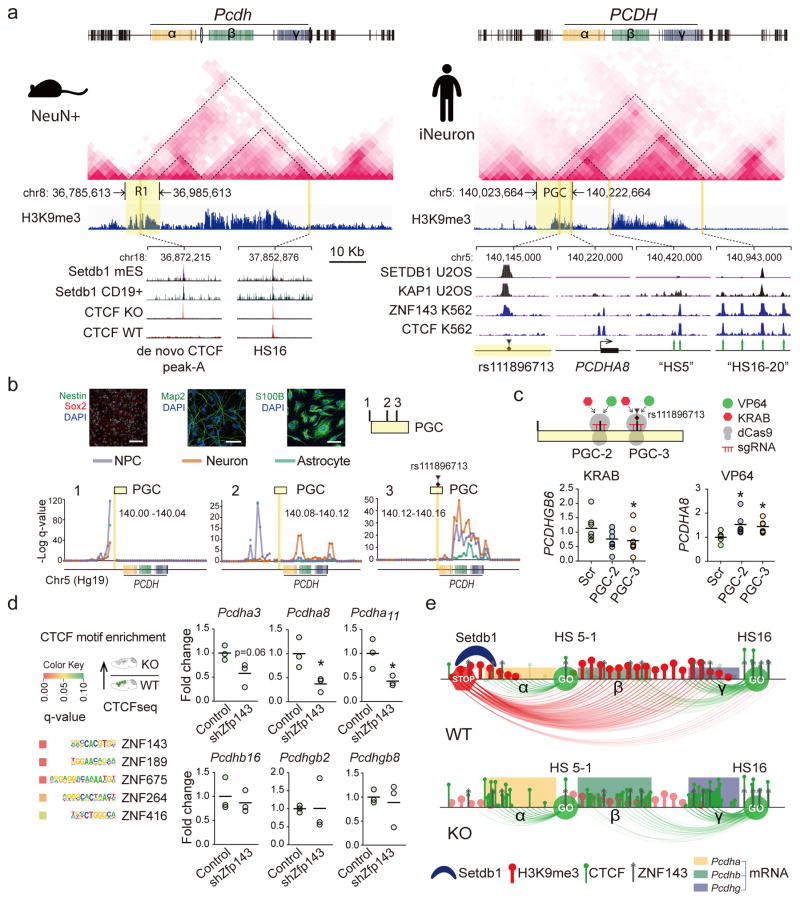
Figure 6. Regulatory mechanisms at human and mouse TADcPCDH.
(a) (Top) Neuronal in situ Hi-C interaction matrices, and H3K9me3 landscapes, for ~2Mb of mouse and human cPCDH, including superTAD spanning across α,β,γ clusters. (Bottom left) Setdb1 peaks in mouse embryonic stem cell and lymphocytes match to de novo CTCF peak in Setdb1 KO neurons. (Bottom right) ‘PGC’, Psychiatric Genomics Consortium risk haplotype chr5:140,023,664-140,222,664 with lead polymorphism rs111896713 matching to Setdb1, KAP1 and ZNF143 peaks. Note epigenomic similarities of ‘R1’ (mouse) and ‘PGC’ (human). (b) Neural progenitor cell (NPC) differentiation into neurons and astrocytes, with phenotypic markers as indicated. Scale bar, NPC (neuron/astrocyte) 100 (50) μm. Conformations for three representative 40kb bins from 200kb ‘PGC’ haplotype, with bin harboring the index polymorphism (‘PGC-3’) showing dramatically increased cPCDH contact. (c) Dot graphs show cPCDH gene expression in epigenomically edited NPC, with PCDHGB6 (but not PCDHGA8) transcript decreased by sgRNA-guided dCas9-KRAB in 3/3 experiments. dCas9-VP64 elicits increased expression of a subset of Protocadherin transcripts. Scr, scrambled control. All data normalized to 18srRNA, shown as fold change. N=6–9/group, P < 0.05, Mann Whitney, two-tailed. (d) ZNF-specific motif enrichments in CTCF-up sequences. Dot graphs (1dot/cell culture) summarize expression of specific Pcdhα, β and γ genes after shRNA-induced Zfp143 knock-down in NG108 neuroblastoma cells. Unpaired t test, two-tailed, N=3 per treatment. *P<0.05 (e) Schematic summary of TADcPcdh epigenomic architectures in WT and KO neurons. Loss of repressive long-range contacts in KO shifts the balance towards facilitative shorter range promoter-enhancer loopings.

