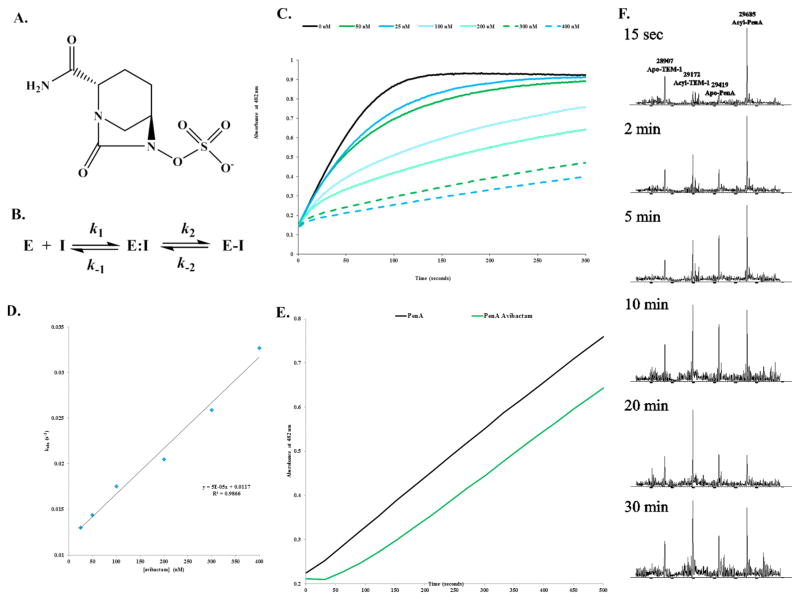
Figure 2.
The avibactam inhibition mechanism of PenA. (A) Chemical structure of avibactam. (B) Scheme representing the interactions of PenA with avibactam.6a In this model, formation of the noncovalent complex, E:I is represented by the dissociation constant, Kd, which is equivalent to k−1/k1. k2 is the first-order rate constant for the acylation step, or formation of E-I. k−2 is the first-order rate constant for the recyclization step or re-formation of E:I. (C) Inhibition of nitrocefin hydrolysis by PenA using increasing concentrations of avibactam measured in absorbance at λ482 nm (absorbance units (a.u.)). (D) Data from panel C were fit to obtain kobs values, and here the kobs values were plotted versus [avibactam]. (E) Recovery of nitrocefin hydrolysis activity by PenA after inhibition by avibactam (green line); PenA alone (black line) without inhibition. (F) Acyl transfer of avibactam from PenA to TEM-1 during a time course started at 15 s and up to 30 min. Molecular weights of apo-PenA, acyl-PenA, apo-TEM-1, and acyl-TEM-1 are 29419 ± 3, 29685 ± 3, 28907 ± 3, and 29172 ± 3 Da, respectively. By 20 min, most of the avibactam had transferred to TEM-1, and by 30 min, some of the avibactam had transferred back to PenA.

