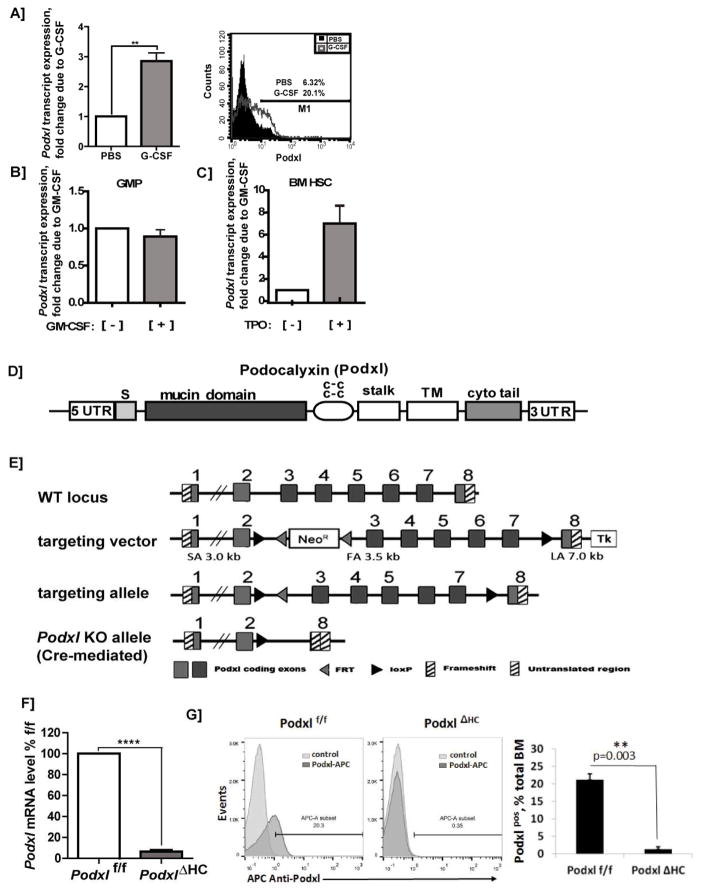
Figure 1. Hematopoietic growth factor induction of Podxl, locus targeting, and hematopoietic deletion of Podxl.
A–C] GCSF, and TPO induction of Podxl expression: A] Up-modulation of Podxl transcript expression in bone marrow granulomyeloid progenitors in vivo: Wild-type C57Bl/6 mice were administered G-CSF (125μg/kg/IP) or PBS. On d6, granulomyeloid progenitor populations were isolated from bone marrow via the retrieval of CD11b, Gr-1, Ly6G positive cells. These hematopoietic progenitor cells (HPCs) were then analyzed for Podxl expression by RT-PCR (left sub-panel)(mean values +/− SE, n=3), and by flow cytometry (right sub-panel). B] Possible effects of GM-CSF on Podxl expression were assessed in isolated bone marrow GM progenitors (GMPs) as lineage negative, CD117+, Sca-1−, CD34+, CD16/32+ cells. These HPCs were challenged ex vivo [+/− GMCSF (granulocyte macrophage colony stimulating factor)], and isolated total RNA was used to determine Podxl levels. C] In HSC, possible effects of TPO on Podxl expression were assessed. HPCs were isolated from bone marrow as Linneg cells (using biotinylated antibodies to CD5, CD11b, CD19, CD45R, Ly6G/C, Ter119). Linneg cells were then labeled with fluorescent antibodies to c-Kit and Sca1, and HSCs were purified via FACS. HSCs were then challenged [+] vs [−] TPO. Total RNA was purified, and used to determine Podxl expression levels. D] Podxl’s structural subdomains are diagrammed including its signal peptide (S), mucin domain, cysteine-rich region (c-c), stalk plus transmembrane (TM) domains, and cytoplasmic tail (cyto tail). E] Targeting (floxing) of the Podxl gene: Details are diagrammed for exon floxing, and Cre-mediated deletion. F] RT-qPCR analysis of Podxl transcripts in hematopoietic progenitor cells from wild-type and PodxlΔHC bone marrow: Hematopoietic progenitor cells (HPCs) were prepared as Linneg populations. Podxl levels were then determined as normalized to beta-Actin (means +/− SE, n=3). G] Representative flow cytometric analysis of Podxl expression in bone marrow cell preparations from wild-type and PodxlΔHC-KO mice (left panel). In the right panel, results for triplicate samples are illustrated (mean % positive +/− SE).

