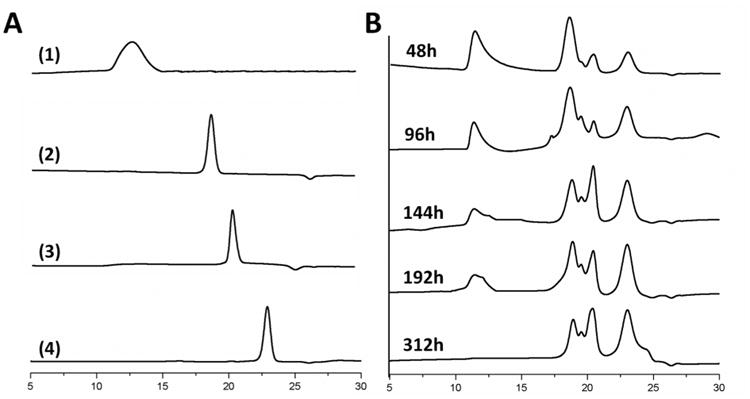
Figure 5.

(A) Individual representative GPC curves for hPR-DFO (1), PEG-BA (2), GSH (3) and hCD-DFO (4). (B) hPR-DFO degradation in the presence of papain was evidenced by noting changes in the apparent molecular weight of the carrier as monitored by aqueous GPC at RT.
