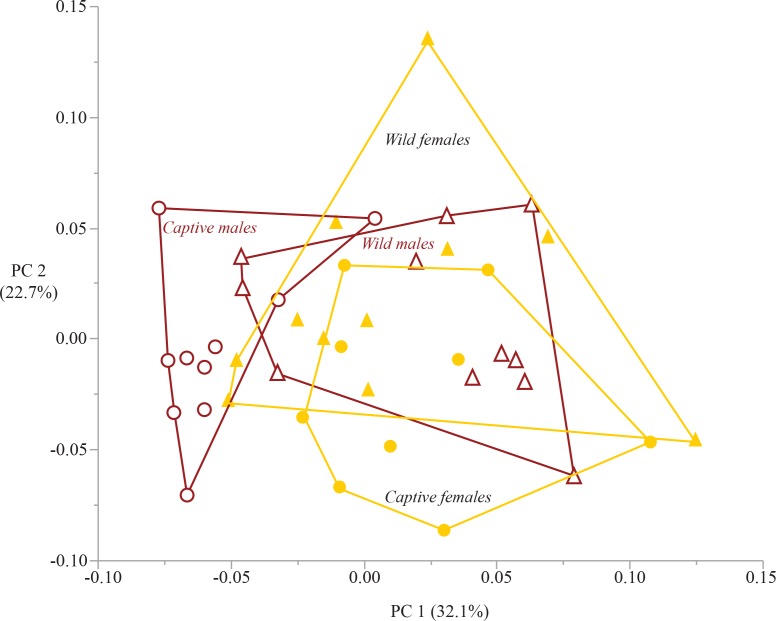
Figure 6. Bivariate plot of principal components 1 and 2.
The plot of PC 1 on PC 2 demonstrates overlap among captive and wild individuals. PC 1 differentiates captive males from the other sex-rearing groups. PC 2 does not differentiate among the four sex-rearing groups. Circles are captive specimens, triangles are wild specimens. Filled symbols are females, open symbols are males. Convex hull polygons enclose each group.

