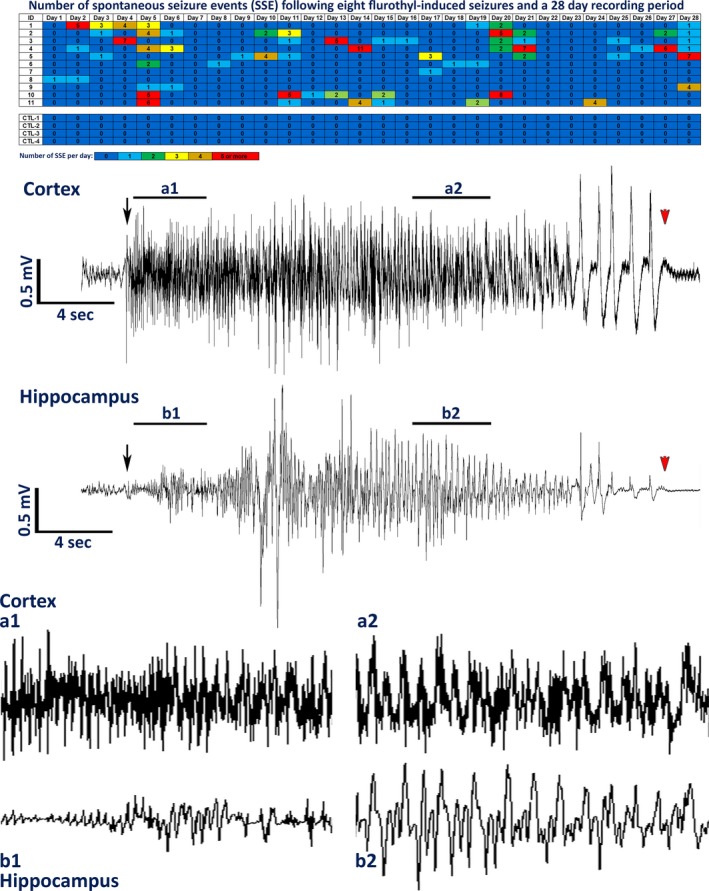
Figure 2.

Total number of spontaneous seizure events recorded from DBA/2J mice following eight flurothyl‐induced seizures and 28 days of 24‐h video‐EEG monitoring. Spontaneous seizures were detected in DBA/2J mice implanted with cortical and hippocampal electrodes. Numbers in the first column indicate animal identifiers (controls [CTL] were simply implanted with cortical and hippocampal electrodes having no flurothyl‐induced seizures). Subsequent columns indicate the day during the recording period following exposure to eight flurothyl‐induced seizures. Each individual box is color‐coded according to the legend. Each of the numbers in these boxes indicates the total number of seizures per day. DBA/2J mice not given flurothyl‐induced seizures (CTL1–CTL4) did not express spontaneous seizures during the recording period. Also presented are low‐ and high‐resolution representative electroencephalograms (EEG; local field potentials) from the cerebral cortex and hippocampus recorded from the same DBA/2J mouse having a spontaneous generalized clonic seizure. Black arrows denote the beginning of the seizure, and red arrowheads indicate the end of the seizure.
