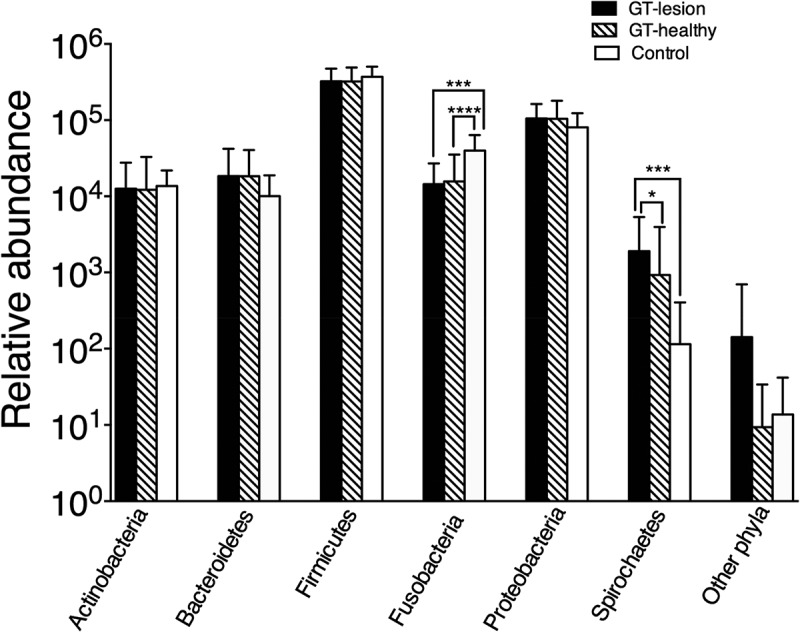
Figure 1.

Relative abundance of the bacterial phyla among patients with geographic tongue (GT) and controls. Values shown are means ± standard deviation (SD). Comparisons between the groups were analyzed by the Kruskal–Wallis test; *p < 0.05; ***p < 0.001; ****p < 0.0001. The group ‘other phyla’ comprises the five phyla listed in Table 2.
