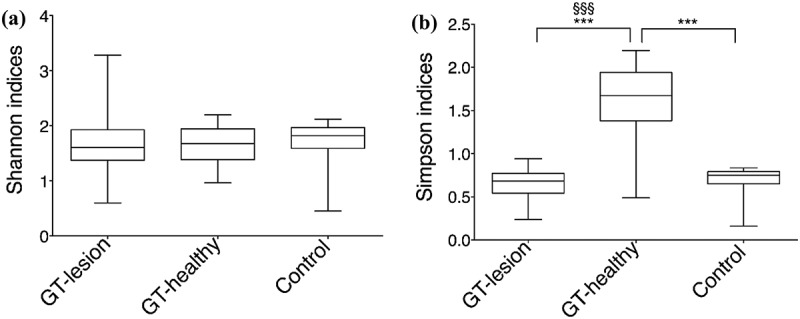
Figure 3.

Diversity indexes at the OTU level. (a) Shannon’s index values; (b) Simpson’s index values. Comparisons between the groups were analyzed by one-way ANOVA, ***p < 0.001 (comparisons between all groups), and Wilcoxon’s signed-rank test, §§§p < 0.001 (comparisons between the paired samples). The 25th and 75th percentiles are shown in the box plot. The median is indicated by the horizontal solid lines. The bars indicate the minimum to maximum values.
