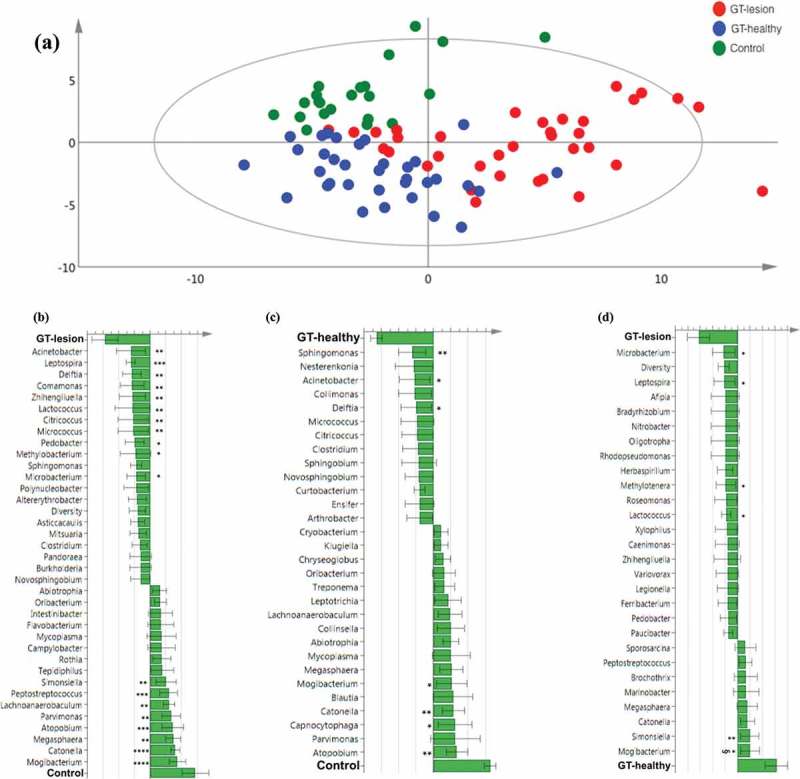
Figure 4.

Differences in the lingual microbiota compositions of patients with GT and controls. The presence or absence of 403 identified OTUs was checked in each individual of the three groups. (a) Principal component analysis. Each symbol represents one individual. The 2D illustration shows that subjects that belong to the same group tend to cluster together, whereas those that belong to different groups remain separated from one another. (b–d) Orthogonal partial least square analysis loading plots. Shown are those OTUs that contribute most to distinguishing between the GT-lesion group and the control group (b), the GT-healthy group and the control group (c), and the GT-lesion group and the GT-healthy group (d). OTUs that show the strongest contribution to the respective models were tested for differences in prevalence using Fisher’s exact tests (or paired t-tests for paired samples). *p < 0.05; **p < 0.01; ***p < 0.001; and §p < 0.05 for paired t-test.
