
Figure 2.
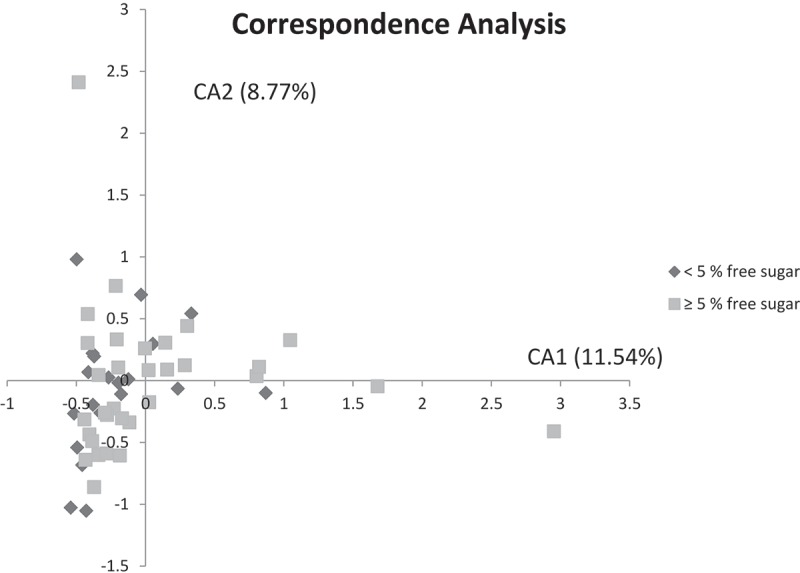
Correspondence analysis visualized two-dimensionally with axes expressed as the two foremost inertia values accounting for a cumulative inertia of 20.31%. Samples from the low-sugar group (dark gray) and samples from reference group samples (light gray).