Fig. 6.
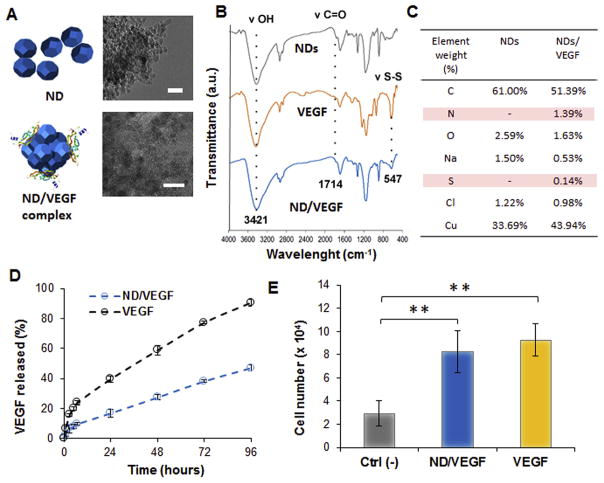
Characterization of the ND/VEGF complex and release from the nanocomposite hydrogel. A) Schematic representing ND and the complex ND/VEGF showing the protein adsorbed on the surface. On the right side corresponding TEM images of ND only and the NDs complexed with VEGF. In both images scale bar = 20 nm. B) FT-IR spectra of NDs, VEGF and the complex. C) EDX analysis of NDs with and without VEGF indicating the presence of nitrogen and sulfur in the complex. D) Release profiles from the hydrogel of VEGF alone or as complex with NDs. E) Quantification of HUVECs proliferation after 48 h. The Ctrl (-) and VEGF groups are referring to cells cultured without any growth factor or in complete supplemented media respectively. In the ND/VEGF group cells were culture in media without growth factors and treated with VEGF released from the nanocomposite hydrogels. Results are reported as the mean ± dev.st. (n = 5). ** = p < 0.01.

