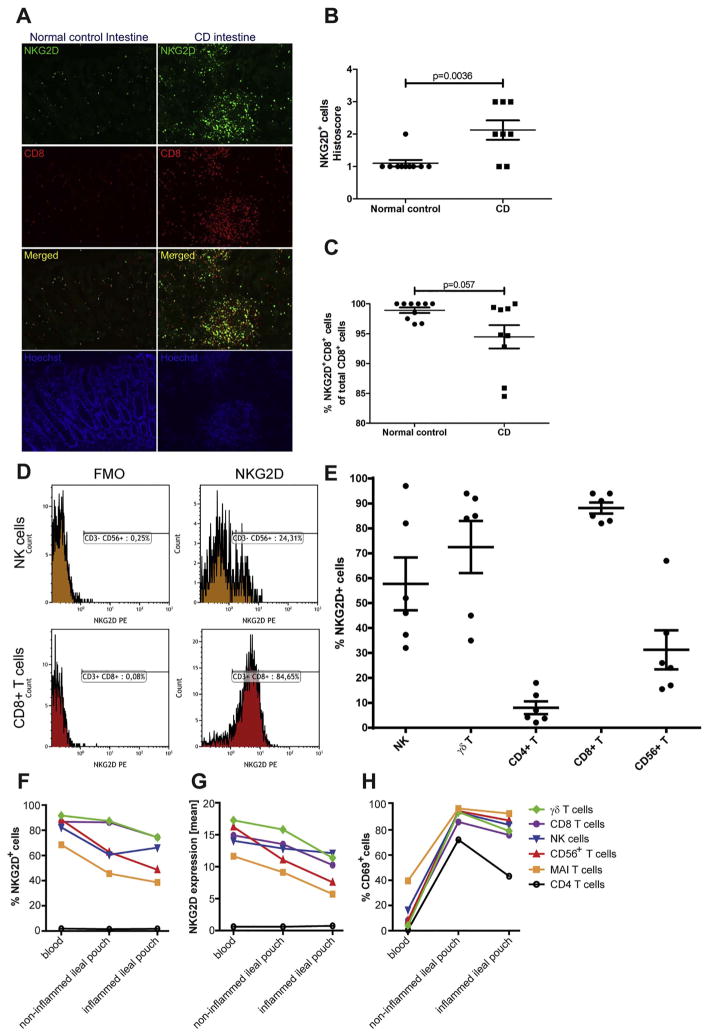
Fig. 1.
NKG2D expression decreases in inflamed tissue and is diverse on different cell subtypes. (A) Immunofluorescence staining of NKG2D (green), CD8 (red), and nuclei (blue) on mucosa of normal control colon (left panel) and inflamed CD colon (right panel). (B) Semi-quantitative scoring (range: 1–3) of number of NKG2D+ cells on NKG2D+ and CD8+ immunofluorescence-stained tissue sections in normal control (n = 10) and CD (n = 11) intestinal samples. t-Test with mean ± SEM. (C) Quantitative analysis of NKG2D and CD8 immunofluorescence-stained tissue sections of normal control (n = 10) and CD (n = 9) intestinal samples. t-Test with mean ± SEM. (D) Representative histograms of flow cytometry NKG2D expression gating on NK cells and CD8+ T cells. Gates were set on live cells with a forward angle and side scatter profile containing lymphocytes and then further gated on CD45+CD3− γδTCR−CD56+ NK cells and CD45+CD56−CD3+CD8+ T cells from the same patient. (E) Flow cytometry analysis of NKG2D expression on specific lymphocyte subsets in the colon of six inflamed CD patients. Shown with mean ± SEM. (F–H) Lymphocytes isolated from peripheral blood and intestine biopsies obtained from CD patients. Percentages of cells expressing NKG2D (F), mean NKG2D expression (G), and percentages of cells expressing CD69 (H) were examined on the indicated lymphocyte populations by mass cytometry. Graphs show data from CD patient #1. A similar trend was observed for CD patient #2. (For interpretation of the references to color in this figure legend, the reader is referred to the web version of this article.)

