Fig. 3.
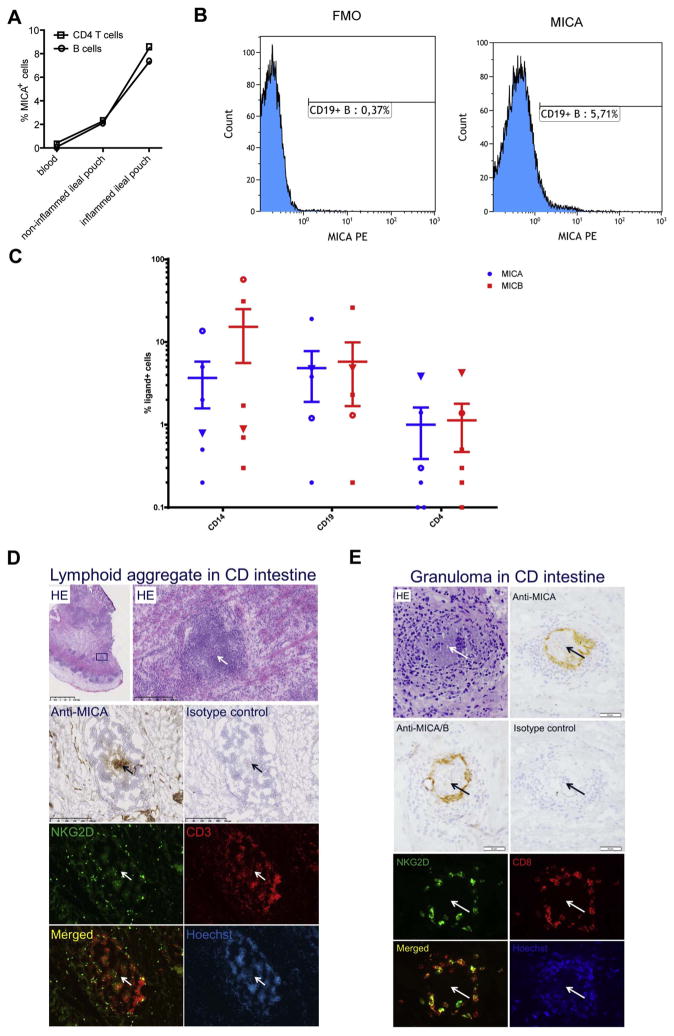
MICA and MICB expression by immune cells in CD intestine. (A) Frequencies of CD4+ T and CD19+ B cells expressing MICA in blood and non-inflamed and inflamed biopsies as detected by mass cytometry. Graphs show data from CD patient #1. A similar trend was observed for CD patient #2. (B) Representative histograms of MICA expression on CD45+CD3−CD19+ B cells, pre-gated on live lymphocytes. (C) Frequency of cells expressing MICA and MICB in intestine from six inflamed CD patients on CD14+ myeloid cells, CD19+ T cells, and CD4+ T cells as measured by flow cytometry. Open dots and triangles denote data points from the same patients across cell types (mean ± SEM, Y-axis is log10). (D) Anti-MICA IHC staining in lymphoid aggregates with NKG2D+ cells. Upper panel shows low and high power images of HE-stained inflamed CD intestine (box in low-power image indicates lymphoid aggregate depicted in the high-power image). Serial sections were immunostained with anti-MICA and isotype-matched control antibodies as indicated or subjected to immunofluorescence for detection of NKG2D (green fluorescence). Co-staining for CD3+ cells (red fluorescence) and nuclei counterstaining (Hoechst) were used to visualize the localization of NKG2D+ cells in the lymphoid aggregate. Arrows indicates the localization of MICA+ cells in the center of the lymphoid aggregate. A similar staining pattern was observed with anti-MICA/B antibody (not shown). Size of scale bars are indicated in the images. (E) Upper two panels show IHC staining with anti-MICA (AMO1), anti-MICA/B (AMO1) and isotype-matched control IgG1 antibodies and HE staining of serial sections of CD intestine. Lower two panels show immunofluorescence co-staining of NKG2D (green), CD8 (red), and nuclei (blue) on serial sections of the same CD intestine. Images show accumulation of cells expressing NKG2D and MICA/B positive cells in a granuloma in inflamed CD intestine. Arrows indicate the central epithelioid macrophages of the granuloma. The size of scale bars is indicated in the images. (For interpretation of the references to color in this figure legend, the reader is referred to the web version of this article.)

