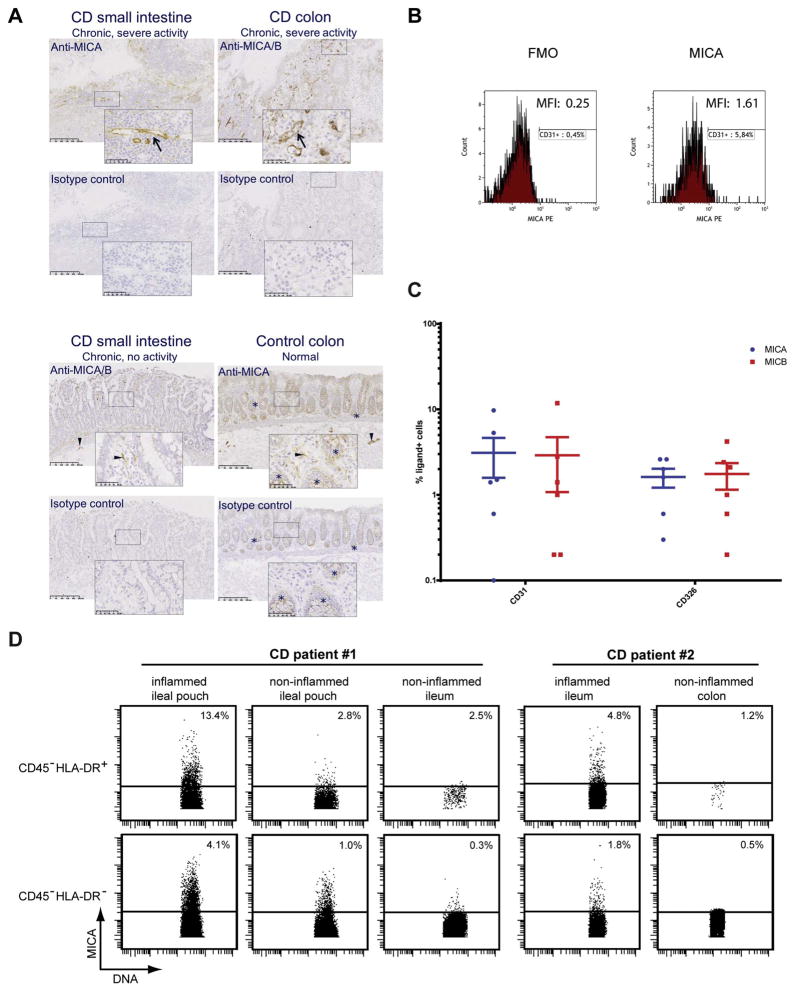
Fig. 4.
Expression of MICA and MICB by non-hematopoietic cells in CD and normal control. (A) Immunohistochemistry with anti-MICA/B antibody (BAMO1), anti-MICA antibody (AMO1), or an isotype-matched control IgG1 on CD small intestine and colon with chronic inflammation and severe activity (upper panels), CD small intestine with chronic inflammation and no activity (lower left panel), and normal control colon (lower right panel). Boxes indicate area of the images that are depicted in the high-power images. Arrows in the upper panels indicate anti-MICA and anti-MICA/B immunostained microvascular endothelial-like cells. Arrowheads in the lower panels indicate anti-MICA and anti-MICA/B immunostained nerve fiber- and submucous plexus-like structures. Asterisks indicate non-specific staining of mucosal epithelium. Size of scale bars is indicated in the images. (B) Representative flow cytometry histograms of MICA expression with geometric MFI values: CD45−CD31+ endothelial cells in the non-hematopoietic population, pre-gated on live cells. FMO includes isotype-matched control staining. (C) Flow cytometry analysis of MICA and MICB expression on CD31+ endothelial and CD326+ epithelial cells in gut from six inflamed CD patients (mean ± SEM, Y-axis is log10). (D) Mass cytometry analysis of MICA expression on CD45−HLA-DR+ cells (i.e. non-hematopoietic tissue cells adjacent to lymphoid tissue) and CD45−HLA-DR−cells (i.e. tissue cells not adjacent to lymphoid tissue). Data from CD patient #1 and #2.

