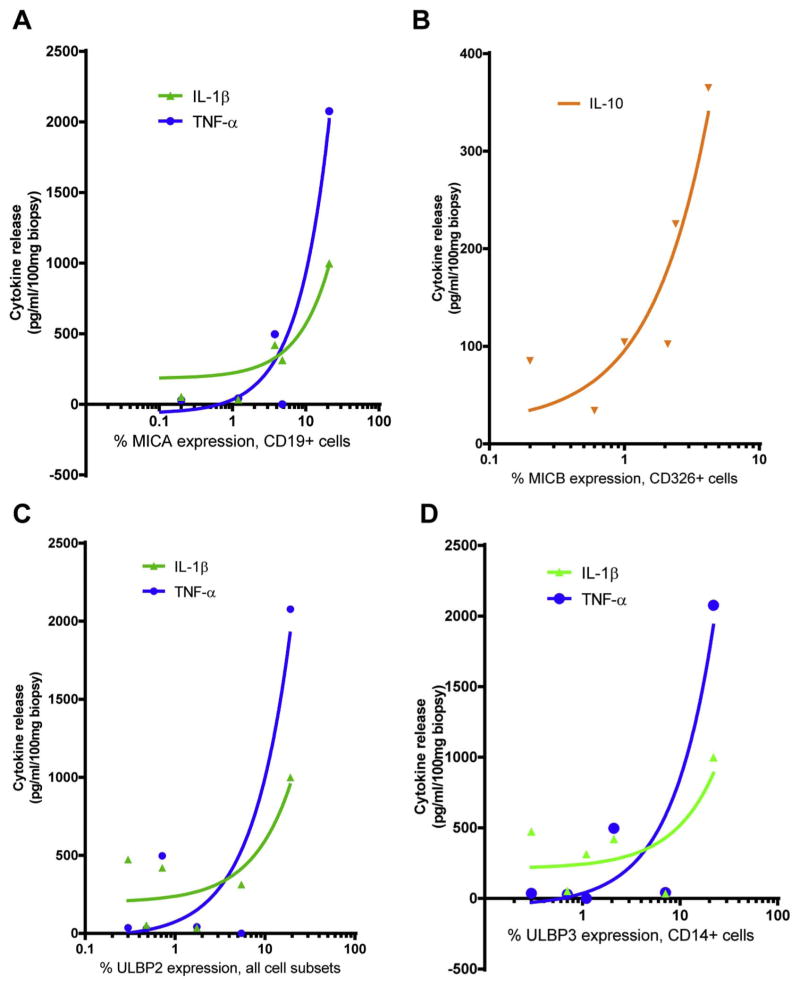
Fig. 6.
Correlation of expression patterns of MICA, MICB, and ULBP1–6 in inflamed CD intestine with cytokine release. Percentages of CD19+ B cells expressing MICA (A) and CD326+ epithelial cells expressing MICB (B) vs. cytokine release (R2 for IL-1β = 0.75, for TNF-α = 0.93, for IL-10 = 0.85). (C) Percentages of all cell subsets (CD4+ T, CD19+ B, CD326+ epithelial, CD31+ endothelial cells, and CD14+ myeloid cells) expressing ULBP2 vs. cytokine release (R2 for IL-1β = 0.68, for TNF-α = 0.85). (D) Percentages of CD14+ myeloid cells expressing ULBP3 vs. cytokine release (R2 for IL-1β = 0.73, for TNF-α = 0.86). All linear regression lines shown are non-zero with P < 0.05 and n = 6 patients, 4 biopsies each. X-axis is log10. The regression findings for each cell type are representative for the majority or all of ligands.

