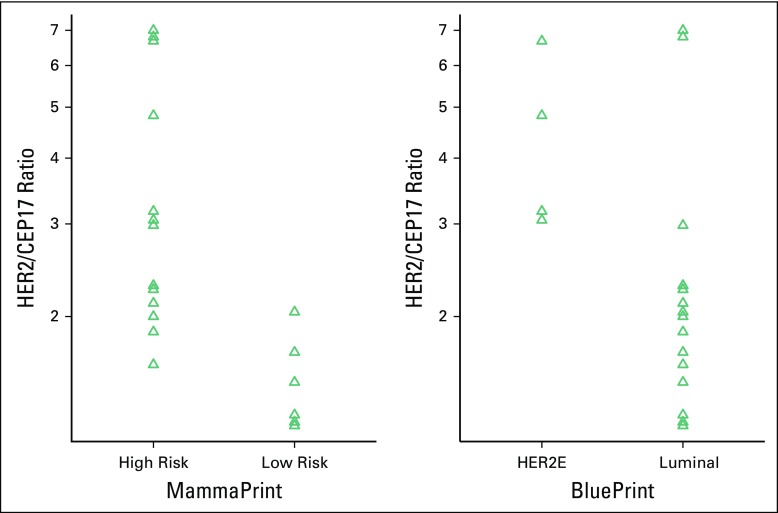
Fig 2.
Strip plots of human epidermal growth factor receptor 2 (HER2)/centromeric probe for chromosome 17 (CEP17) ratios on log-scale for both MammaPrint risk and BluePrint subtyping. Distributions are closer to normality, but variances remain different. The difference in means of the HER2/CEP17 ratio was significant for molecular subtype (P = .0249; 95% CI, 0.12 to 1.21 logs) and MammaPrint risk (P = .0002; 95% CI, 0.40 to 1.06 logs).

