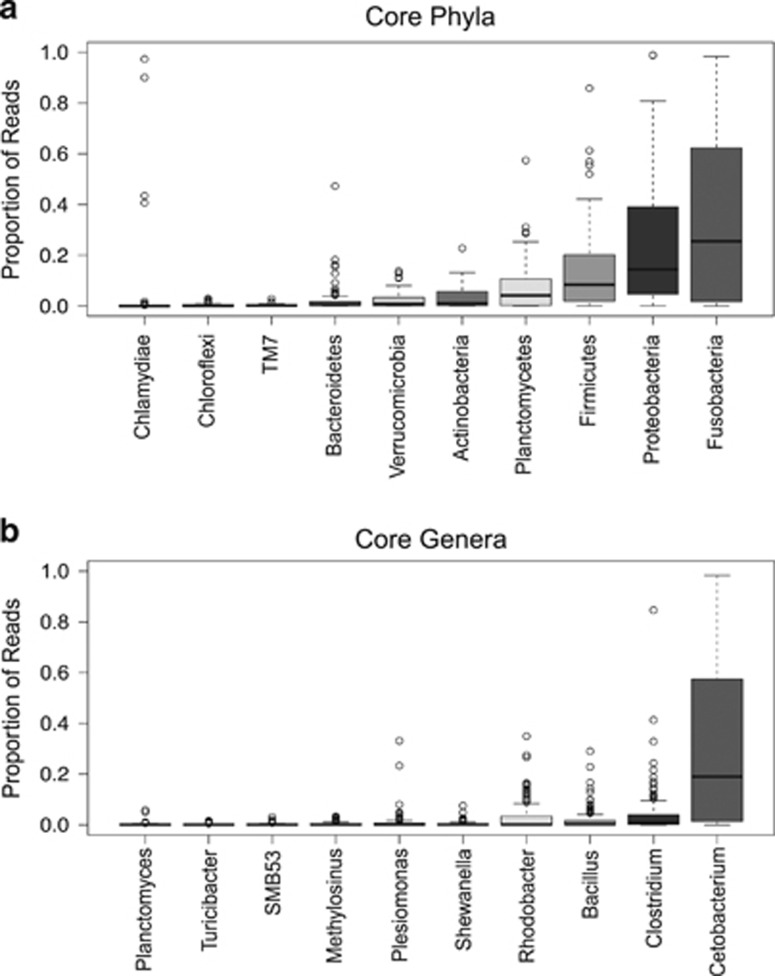
Figure 2.
Relative abundance of core phyla (a) and genera (b) across all samples. Core taxa were defined by presence in all species and at least 80% of the specimens. Interquartile ranges (25th and 75th percentiles) and whiskers show data dispersion across specimens. Medians are shown as central horizontal lines.

