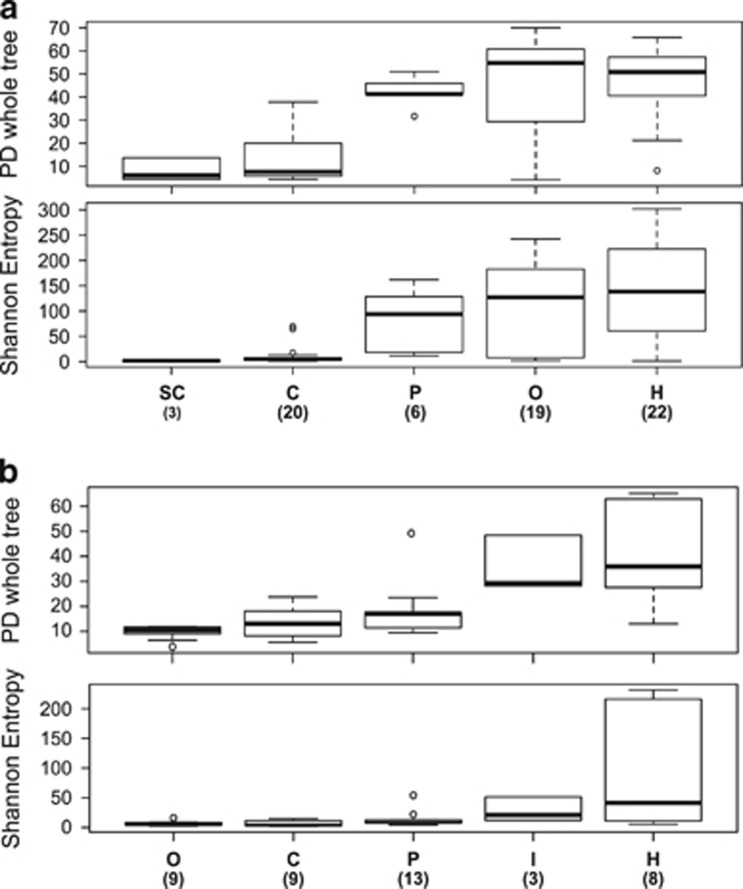
Figure 4.
α-Diversity (Shannon entropy and phylogenetic diversity (PD) whole tree) by diet category in (a) Tanganyika and (b) Barombi Mbo. For each diet category, boxplots are centered at the median and whiskers show data dispersion across specimens (number within brackets) and ordered according to Shannon median values. Herbivores are significantly more diverse than carnivores at both lakes (P<0.05, two-sample t-test with Bonferroni correction). Statistically significant pairs are: for Tanganyika (both indexes), H versus SC, H vs C, O vs SC, O vs C, P vs C; for Barombi Mbo (PD whole tree only), H vs C, H vs O, H vs P, I vs C, and I vs O (P<0.05).

