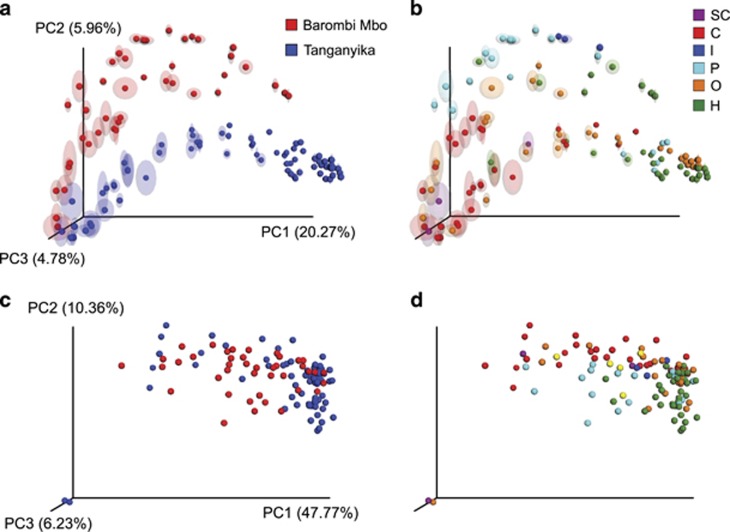
Figure 5.
Principal coordinate analysis (PCoA) of cichlid gut bacterial communities according to lake (a and c) and diet (b and d). (a and b) Taxonomic (OTU) clustering based on unweighted UniFrac distances. Circles represent individual specimens, with ellipses showing range of variation after multiple rarefactions to an even depth (13 000 reads). (c and d) Functional (KO) composition clustering based on binary Jaccard, after rarefaction to 1 835 713 gene counts. Barombi Mbo (red) and Tanganyika (blue) specimens significantly separate at both the taxonomic (along PC2) and functional level (along PC3). Given the time of divergence between the two radiations, deep phylogenetic and geographic effects are here intrinsically linked. Within lakes, diet explains most taxonomic and functional bacterial variance, with a clear divergence between carnivores (C) and herbivores (H).

