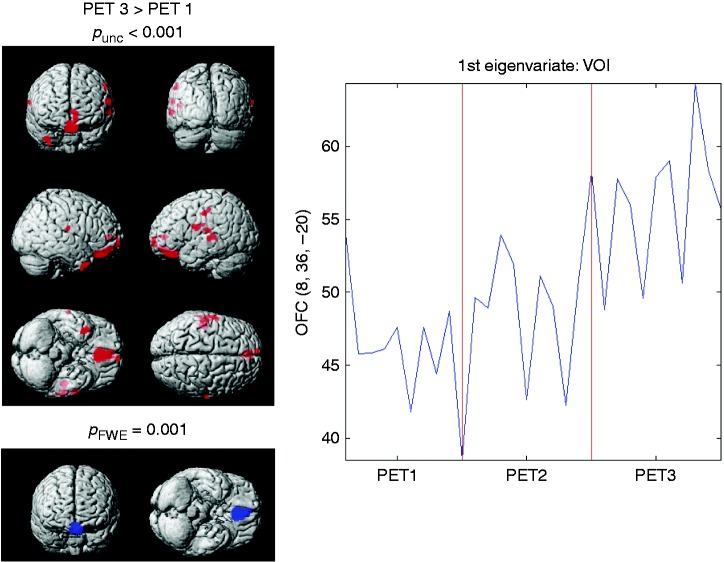
Figure 4.
FDG uptake for PET 3 vs PET 1 in compliant MO patients (n = 10). Data were controlled for attack-related modifications. Left: Fronto-temporal metabolism is increased after three months of eTNS treatment (in red: p < 0.001 uncorrected, 20 voxels). The OFC remains significant after correction for multiple comparisons (in blue). Right: First eigenvariate extraction around 10 mm from the peak voxel in the OFC (coordinates obtained from the comparison between PET1 and HVs).
FDG: 18-fluorodeoxyglucose; PET positron emission tomography; MO: migraine without aura; OFC: orbitofrontal cortex; HVs: healthy volunteers.

