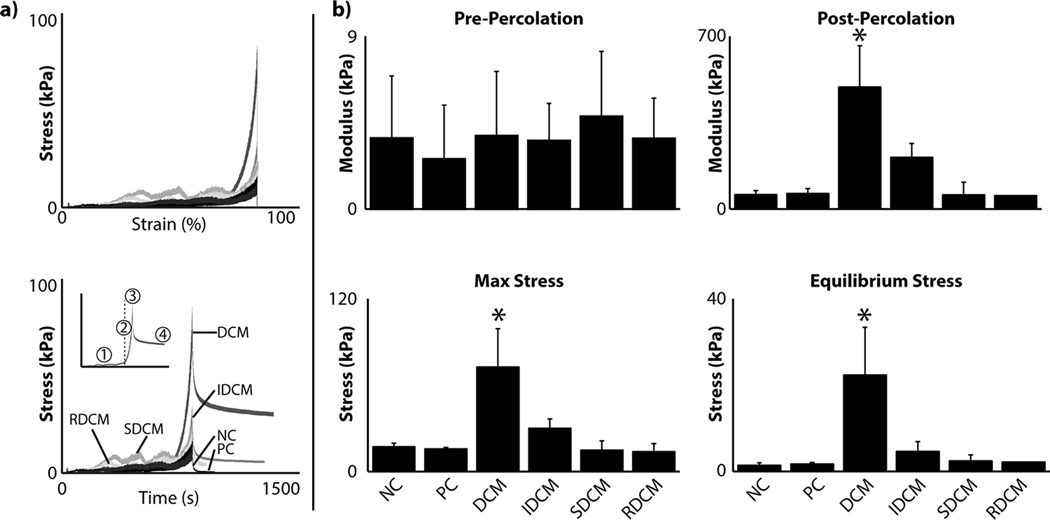
Figure 2.
Cartilage microparticles influenced composite matrix mechanical properties. a) Representative stress plots show differences in cartilage microparticle groups plotted against both strain and time. Inset shows different regions of interest for mechanical analysis: (1) low strain linear modulus, (2) high strain, post-percolation threshold modulus, (3) maximum stress, and (4) equilibrium stress, where the dashed line shows the percolation threshold. b) At low strain, where the collagen matrix dominates the mechanical properties, there was no significant difference among samples (p=0.820). Post-percolation threshold and for the duration of the mechanical compression, the response was significantly different for percolation linear modulus, maximum stress, and equilibrium stress, where the DCM sample was higher in all categories (*=p<0.001).

