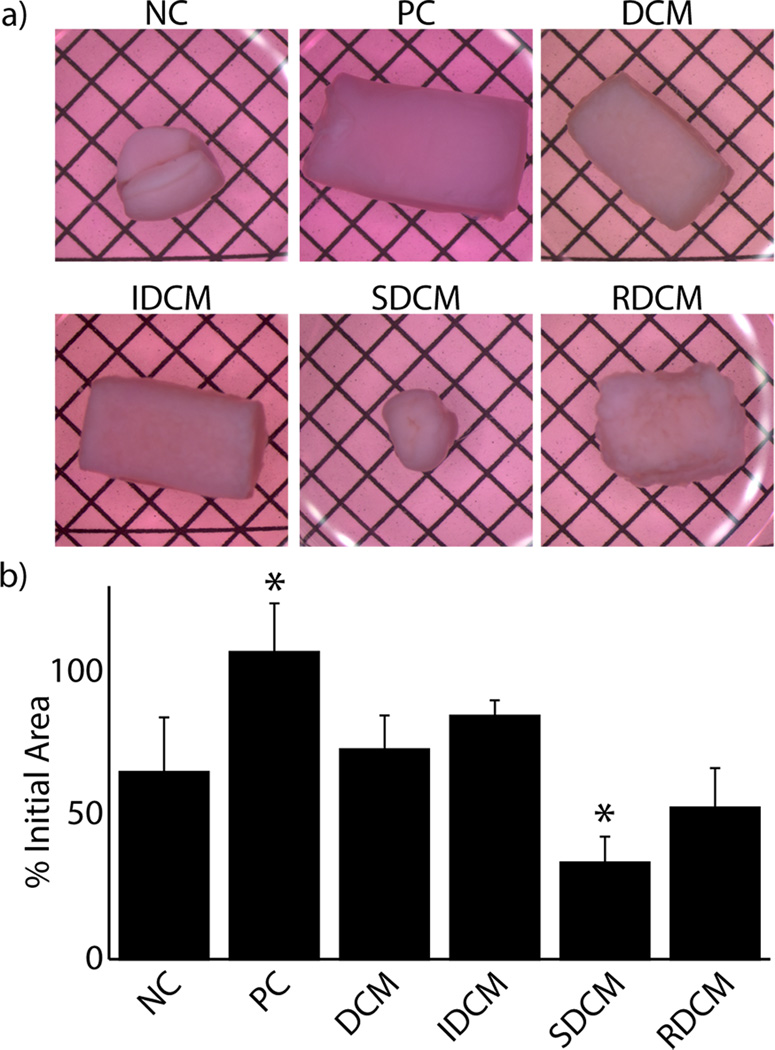
Figure 4.
Treatment groups exhibited varied cell-mediated contraction through the two week cell study. a) Representative images of cellularized samples at the end of the two week culture period show maintained bulk morphology in positive control (PC, i.e. a TGF-β3 supplemented culture media in the absence of any microparticles), DCM, and IDCM samples (grid spacing = 2.1 mm). b) Quantitative analysis of these data suggest significantly increased cell-mediated contraction in SDCM and RDCM samples. (*=p<0.001 compared to the NC group.)

